Decoding the Boston Marathon 2025 using Mobility Intelligence


Applying Location-based Big Data for Analyzing Global Events
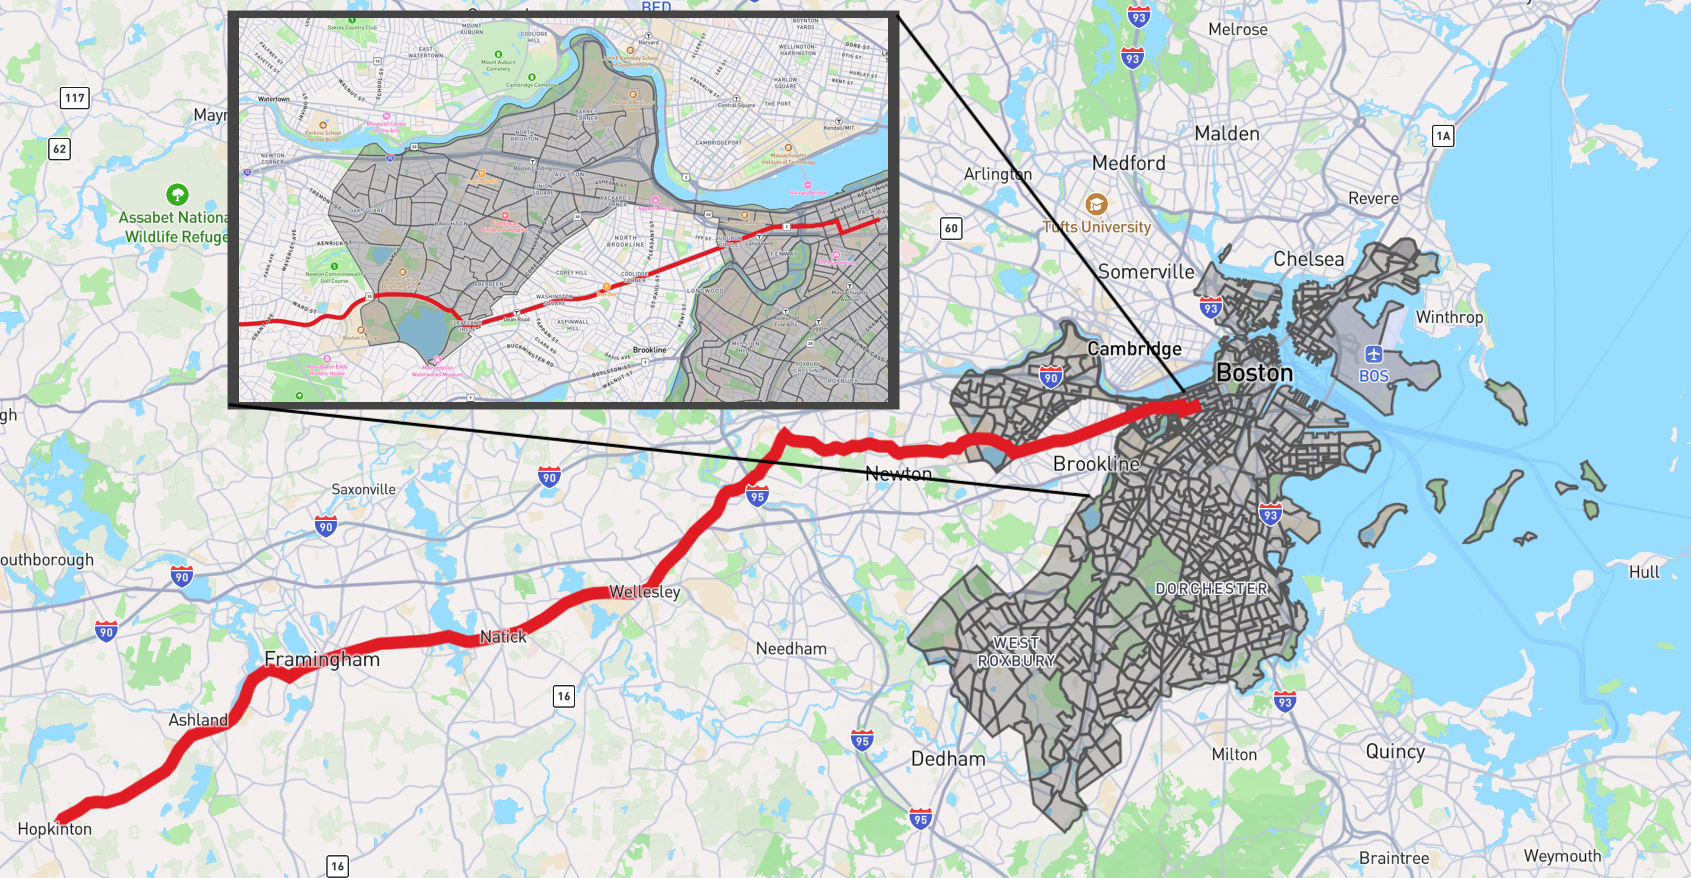
The 2025 Boston Marathon was a spectacular display of endurance, drawing over 30,000 participating runners and hundreds of thousands of spectators lining the 26.2-mile course from Hopkinton to Boylston Street. Taking place on Monday, April 21, 2025—the traditional Patriots' Day running—the event saw ideal racing weather with sunny skies and temperatures climbing from the mid-40s into the 50s. With athletes traveling from around the globe and historic course records shattered by winners like Sharon Lokedi, who clocked an incredible 2:17:22, and John Korir, finishing at 2:04:45, the sheer volume of human movement across the region was immense. Marcel Hug and Susannah Scaroni also continued their dominance, securing victories in the men's and women's wheelchair divisions.
Recently, a major customer in Massachusetts asked us to analyze the visitation and movement patterns of the 2025 Boston Marathon. Measuring mobility during high-footfall, globally recognized events presents a unique set of challenges. In this post, we'll explore the foundational issues of location-based data analysis at this scale and how CityData builds intelligent models to map event visitation accurately.
International Participants and Support Crew
The B.A.A. officially recorded participants from 118 countries of residence (and 125 countries of citizenship) for the 2025 Boston Marathon. CityData has compiled a comprehensive breakdown of the most represented countries, alongside a wide sample of the international drill-down data available from the 2025 B.A.A. official statistics.
To extrapolate the expected number of friends, family members, and visitors, we have applied a standard sports tourism multiplier of 2.5 accompanying visitors per athlete. Because traveling to a major world marathon is often a milestone event, it is highly common for runners to bring a support crew of spouses, children, or friends, though international travel costs might slightly lower this for distant countries.
Based on this multiplier, the 21,412 athletes from the United States brought an expected 53,530 family and friends. Canada's 1,799 athletes brought roughly 4,498 visitors, Great Britain's 1,384 athletes brought 3,460 supporters, and Mexico's 719 runners brought 1,798 guests. We applied this model across dozens of nations—from Germany (420 athletes and 1,050 visitors) to smaller contingents like the Cayman Islands (9 athletes and 23 visitors) and Mongolia (5 athletes and 13 visitors).
Inferring Home Census Block Groups
When analyzing visitation and movement, location data platforms often rely heavily on "home inference"—the process of determining a device's origin based on nighttime dwell patterns.
The standard industry-tested approach for using location-based data is to infer home neighborhoods of census blocks by looking for overnight stay patterns. For example, if a device spends 3 nights a week in a census block and repeat the pattern for 3 weeks in a month, and for 3 successive months, that would result in the census block getting labeled as the "Residential CBG" for said device.
Realistically, home neighborhoods or CBGs are assigned with a lowered threshold of a device spends 3 nights per week in a census block and repeating that pattern for 3 weeks in a month. This approach works well for locals and succeeds at labeling them as "Residents". However, this approach has the drawback of also labeling out-of-city or out-of state or international visitors as residents if they stay within the city for longer durations.
The Core Problem with Home Inference
Presenting projected visits strictly through the lens of inferred residential neighborhoods implies we can infer a home location for all recorded visits.
This assumption breaks down during massive events. In reality, two groups are excluded from home inference: (a) devices with insufficient data to determine a home, and (b) out-of-state or international visitors. When we project visit totals using only the proportion of devices we do have homes for, we're essentially distributing the full visit count across a smaller-than-actual population which inflates the numbers for those home blocks.
Consider the Boston Marathon as a baseline example.
- If we observe an inferred visit count of 50,000 attendees for a specific segment, but visits with a successful home inference total only 25,000 (or 50%).
- A naive projection distributes all 50,000 visits proportionally back to the home blocks of those 25,000 known visitors.
- The correct framing must recognize that 25,000 came from known blocks, while the other 25,000 originated from unknown or international sources.
We have seen extreme cases of this phenomenon in other open-attendance events. For instance, a blind distribution might assign over 100,000 visits to a single Census Block Group with a total population of roughly 1,200 people. This implies effectively every resident attended, many of them multiple times. This is the clearest illustration of what goes wrong when a large volume of visits with no home inference gets force-distributed onto a small, well-inferred population. The result isn't just inflated, it's physically impossible.
Understanding Global Event Audiences
When customers analyze major global events, it is vital to communicate that inference rates vary by event type by design, not by data quality. High-footfall or tourist-heavy events like the Boston Marathon will naturally attract more out-of-area and international visitors, which lowers the inferrable home percentage. This is expected behavior, not a data flaw. The visits themselves are still valid, as the limitation is in where those visitors came from, not whether the visit occurred.
Furthermore, international home inference is a deliberate scope boundary. It requires cross-border data sourcing, different resolution methodologies, and substantially more processing overhead. This is not a capability gap it is a conscious decision to keep the product focused and cost-effective for domestic use cases. For meaningful demographic analysis, full inference is not required, as a 40-60% inference rate on a large event is still statistically significant. Projections are modeled estimates, not census counts, and should be interpreted directionally.
Geofencing, Attribution, & Multi-Block Events
Another foundational challenge involves how we attribute mobile pings to an event rather than incidental background traffic.
For non-venue outdoor events, the movements might not just be a function of the location-based data panel of people physically attending the event itself, but also a function of observed visits to Point of Interest (POI) or local business locations in the immediate vicinity of the event. Our goal would be to capture people who stood on the street watching the event and then walked into a coffee shop near the street.
This becomes highly complex for events spanning multiple blocks or CBGs across wide geographic areas. For events like the Boston Marathon finish line, we map-distribute the visits along the expansive route across multiple CBGs as people move fluidly across boundaries.
CityData’s Innovative Algorithmic Solutions
To solve these spatial and scaling issues for our major customer in Massachusetts, we implemented a sophisticated suite of safeguards to ensure accurate mobility intelligence:
- Population and Hotel Capacity Caps: We cap movements as a proportion of a Census Block Group population. Blocks with hotels are allowed a higher ceiling to account for transient visitors.
- Reattributing the Gap: We attribute the remainder to no-home or international movements rather than forcing full distribution onto known home blocks.
- International Validation: For specific events with known published participant data like the Boston Marathon, we verify and validate the international movement to infer expansion ratios at the country level.
- Proximity and Population Weighing: We built a model that estimates how many visitors each CBG would send based on population and hotel guests. We assign each origin CBG's estimated visitors to locations along the route based on proximity.
- Substitutions for Zero-Population Areas: If a block group has zero population on record (e.g., a park), we substitute the average population of all the other block groups along the route so it still gets a reasonable share rather than being left out.
- Macro-Level Assignments: For non-residential shapes like neighborhoods or districts, we assign the full visit counts. These are larger aggregation areas that encapsulate the route, meaning the event effectively "happened in" each of them entirely.
Visit Inferences and Dwell Time Insights
Using our CityEvents product, which estimates the attendance, movement trends, and demographics for major gatherings, we compiled a high-fidelity dashboard of marathon crowds.
Our platform analyzed a total of 443,904 event visits. The average time spent by visitors was 58.4 minutes. Our movement data revealed that the average distance traveled to the event was 1.5 local miles, 5.6 regional miles, and an impressive 647.6 national miles.
When breaking down event visitation counts by sub-districts and major POIs, the broader Boston City Boundary recorded 441,732 visits. More localized neighborhood hubs also saw enormous footfall, with the Brighton area capturing 152,000 visits, the Back Bay logging 105,559 visits, and the Fenway area recording 101,509 visits.
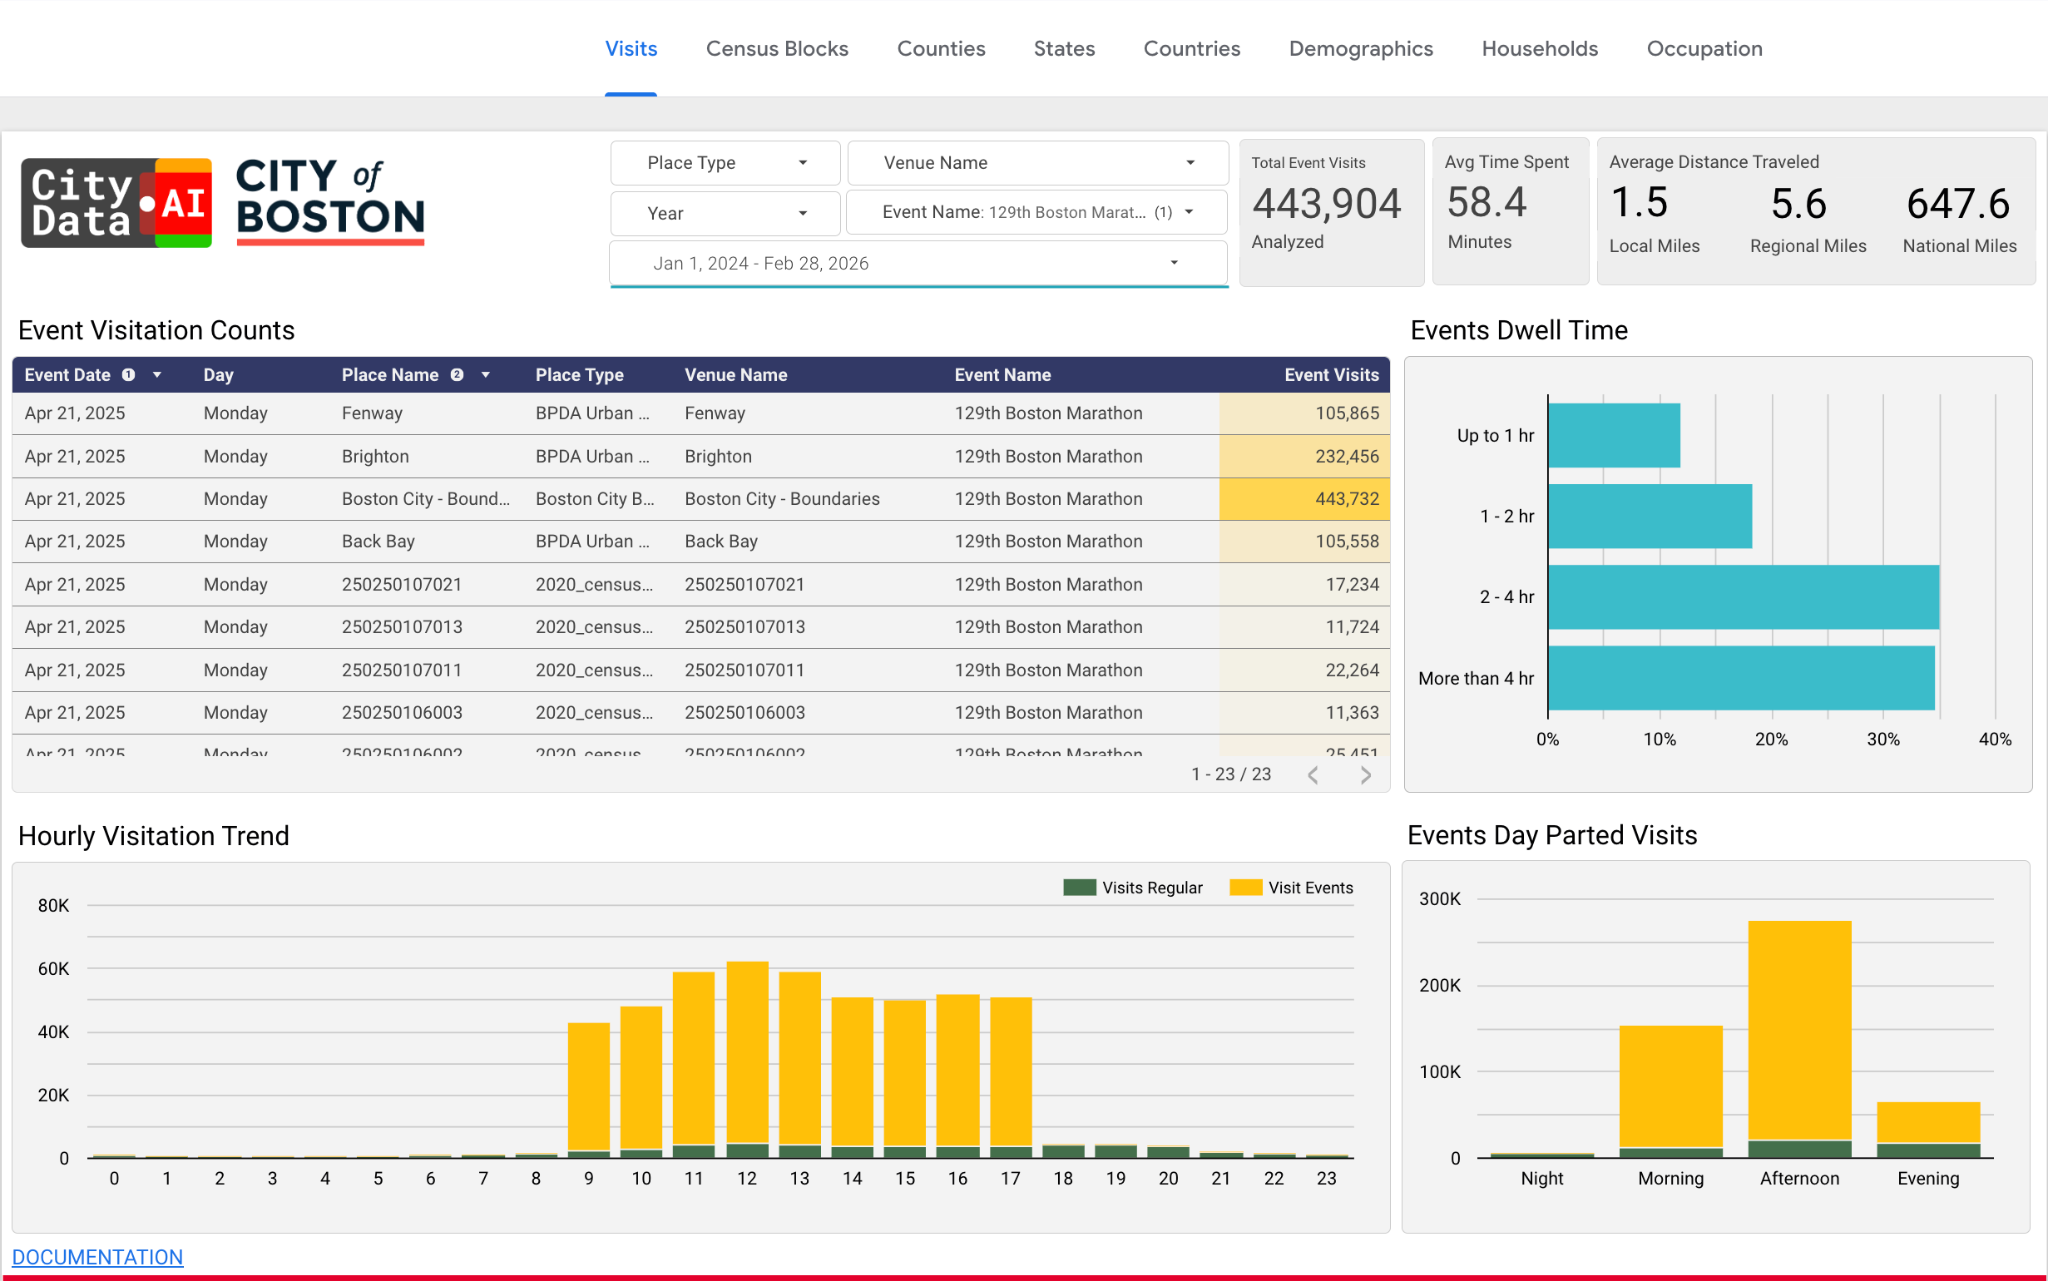
The dedication of the marathon's spectators is best highlighted by our dwell time analytics. A massive proportion of visitors stayed between 2-4 hours, or more than 4 hours, with each category accounting for roughly 30% to 40% of the total crowds.
This extended dwell time aligns perfectly with our Hourly Visitation Trend data, which shows crowd density peaking between 11:00 AM and 2:00 PM (hours 11 through 14), sustaining over 60,000 concurrent visits per hour. Consequently, day-parted visit volume was heavily concentrated in the Afternoon, followed by the Morning, with a sharp drop-off in the Evening.
Scaling up Visits from Location-Based Data
GPS data is often collected from a subset of individuals. Such location-based mobility data typically represents a sample of the population, not the entire population due to factors like smartphone ownership, app usage, and user demographics.Therefore, we need robust scale-up methodologies to extrapolate from the sample to represent the true visitation counts.
Several methods exist for scaling GPS crowdsourced data. Here are some common approaches:
Ratio-Based Scaling: This method involves calculating a ratio between the number of visitors observed in the GPS data and a known population or benchmark for the area of interest. For example, if we know the total population of a census tract and we observe a certain number of visitors in our GPS data, we can calculate a scaling ratio and apply it to other observed data points. This is similar to the residential inference and daily ratio methods described in the previous blog post.
Demographic Weighting: If the GPS data sample is biased towards certain demographics, we can apply weights to adjust for these biases. For example, if our sample overrepresents younger individuals, we can weight the data to better reflect the age distribution of the overall population.
Trip Chaining and Expansion: This approach involves analyzing trip patterns to infer visits to multiple locations. If a device is observed at a park and then later at a restaurant, we can infer a visit to both locations, even if the GPS data is only available for a portion of the trip. Expansion factors are then used to account for trips not captured in the data.
Hybrid Approaches: Often, a combination of these methods is used to achieve the most accurate results. For instance, we might use ratio-based scaling combined with demographic weighting to adjust for both sample size and demographic biases.
Event Movement Mapping: Global to Local Scale
CityData’s dashboard provides granular mapping capabilities that trace visitor origins from the local census block up to the international level.
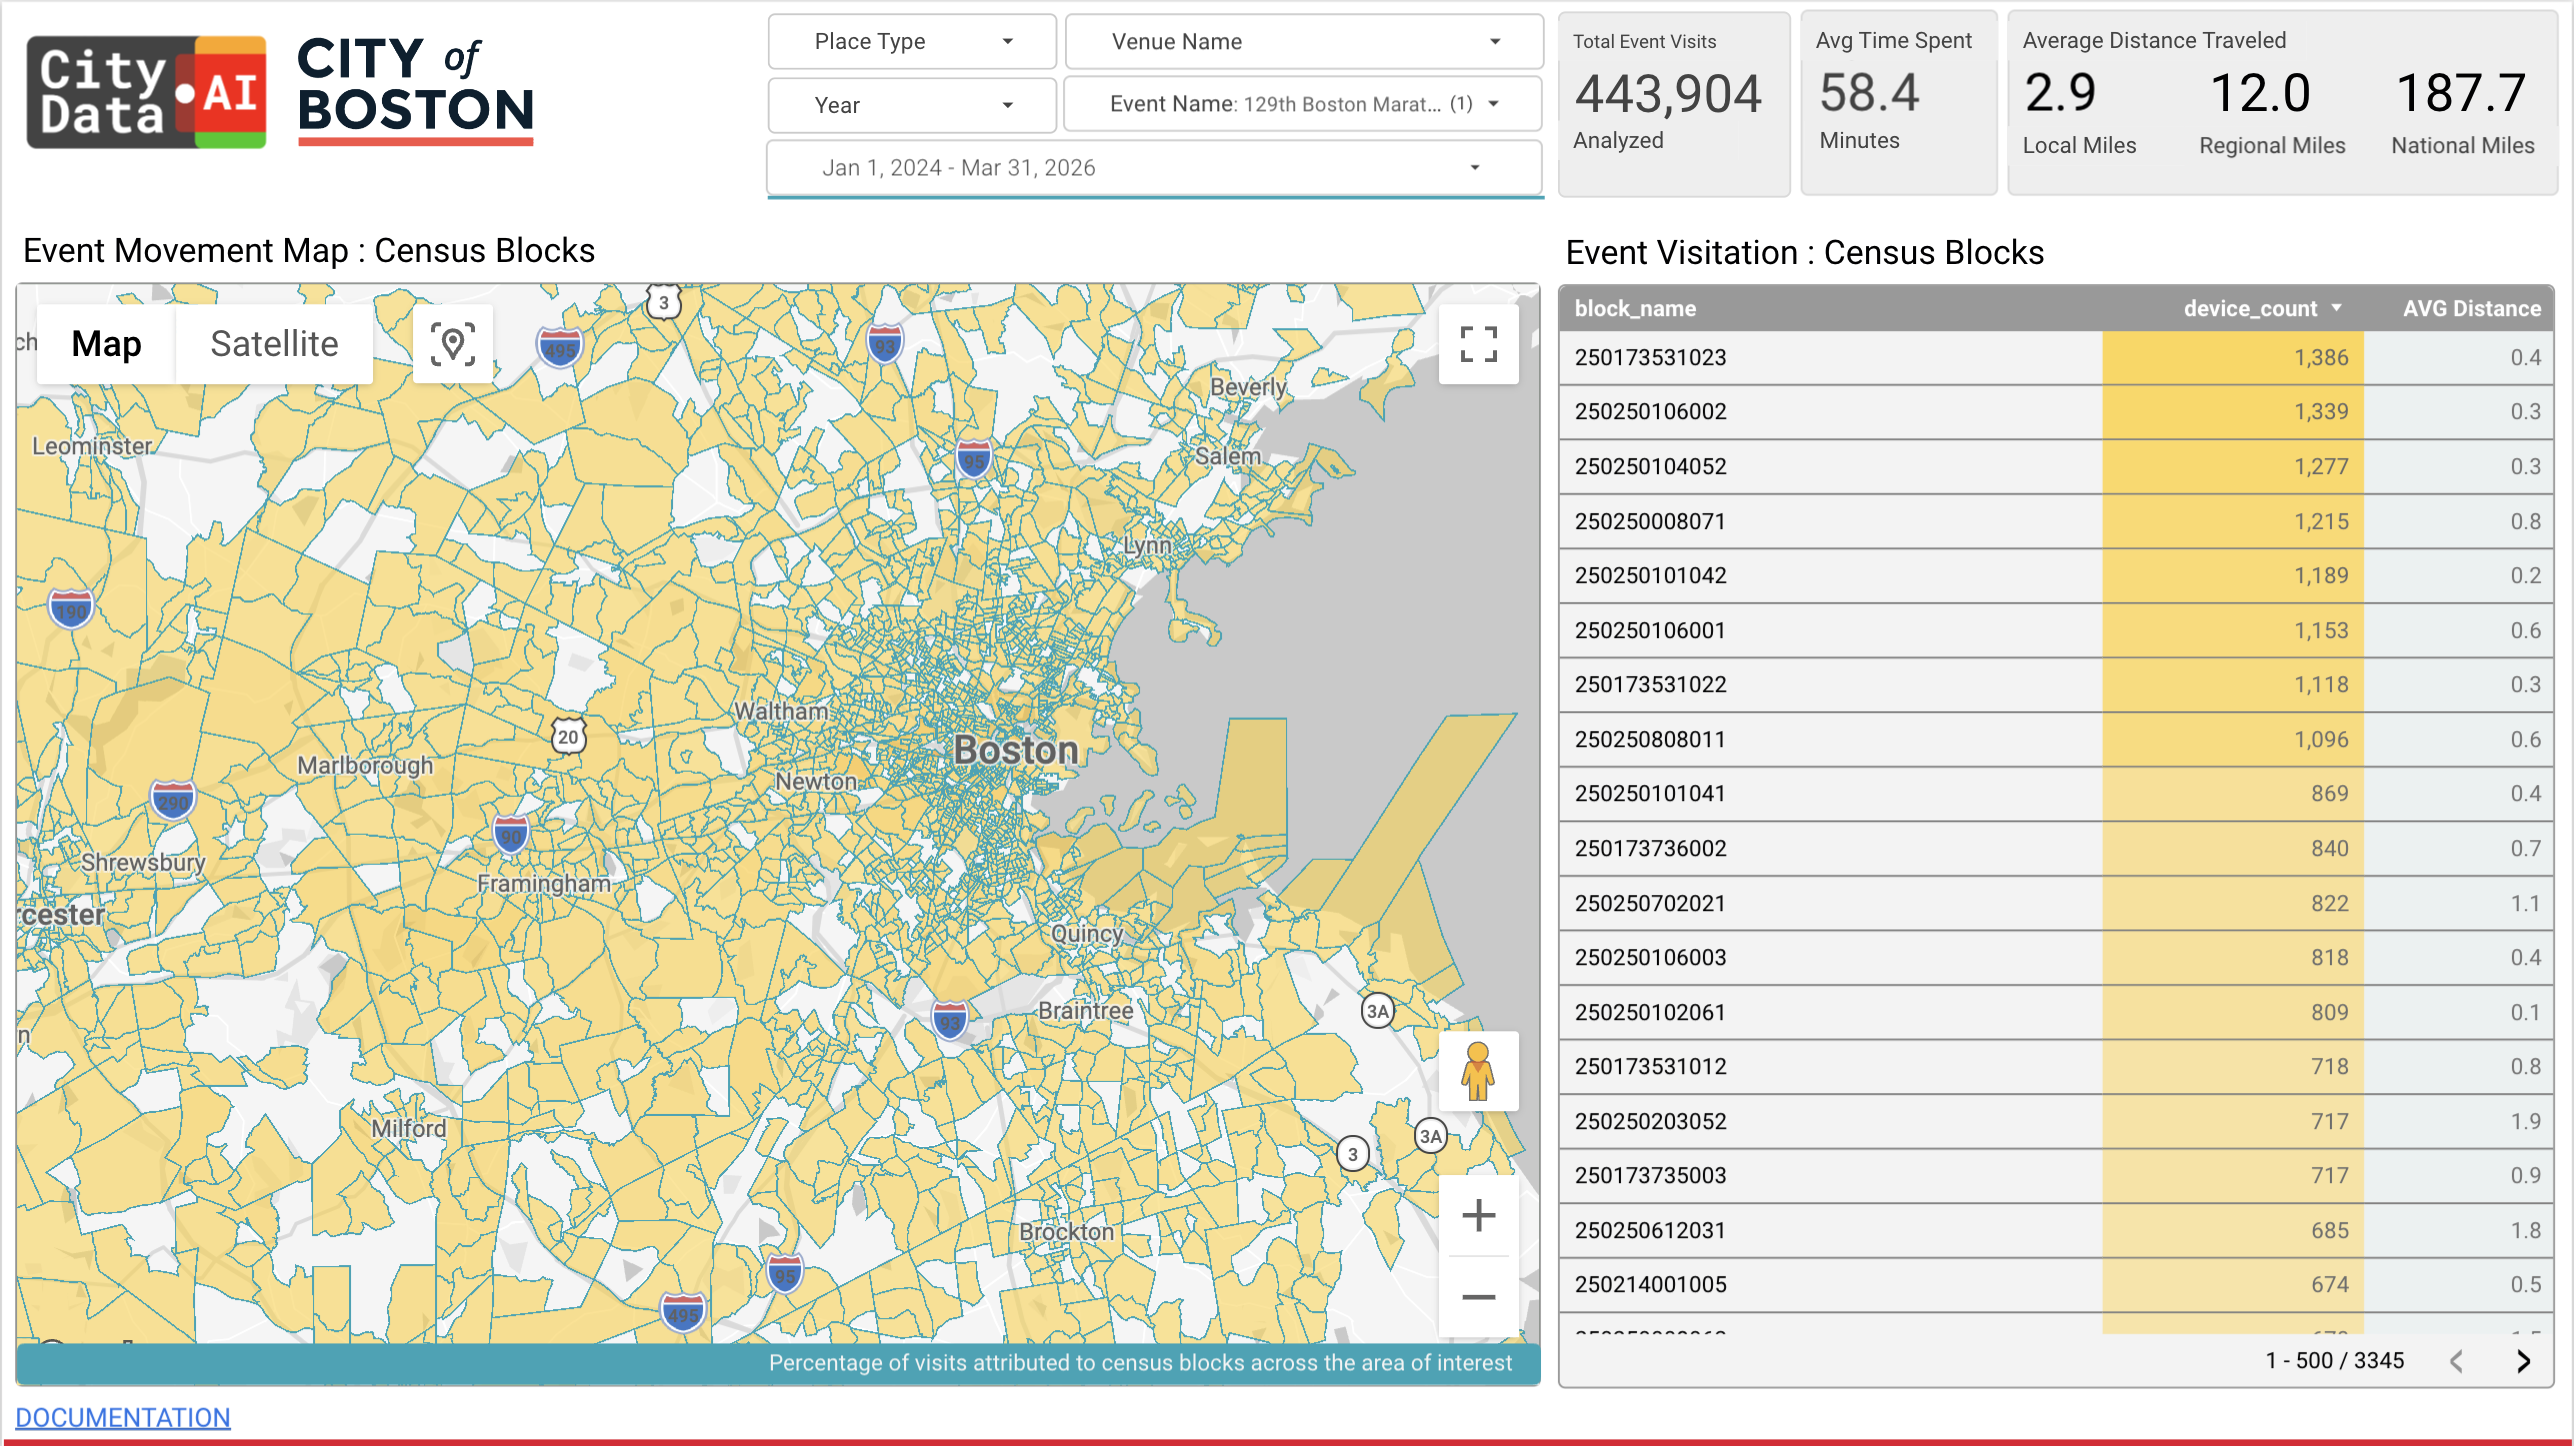
Local Visitors within Massachusetts (Census Blocks):
Our platform utilizes activity heat maps, which show the relative spatial density of movement within a defined polygon boundary. They are intended for spatial pattern recognition, rather than measuring total visits, highlighting exactly where visitors tend to cluster.
The local event movement map demonstrates intense clustering within the immediate Boston urban core. Specific census block groups (CBGs), such as block 250173531023, recorded 1,386 origin visits, while other heavily populated local blocks logged between 600 and 1,000 origin visits.
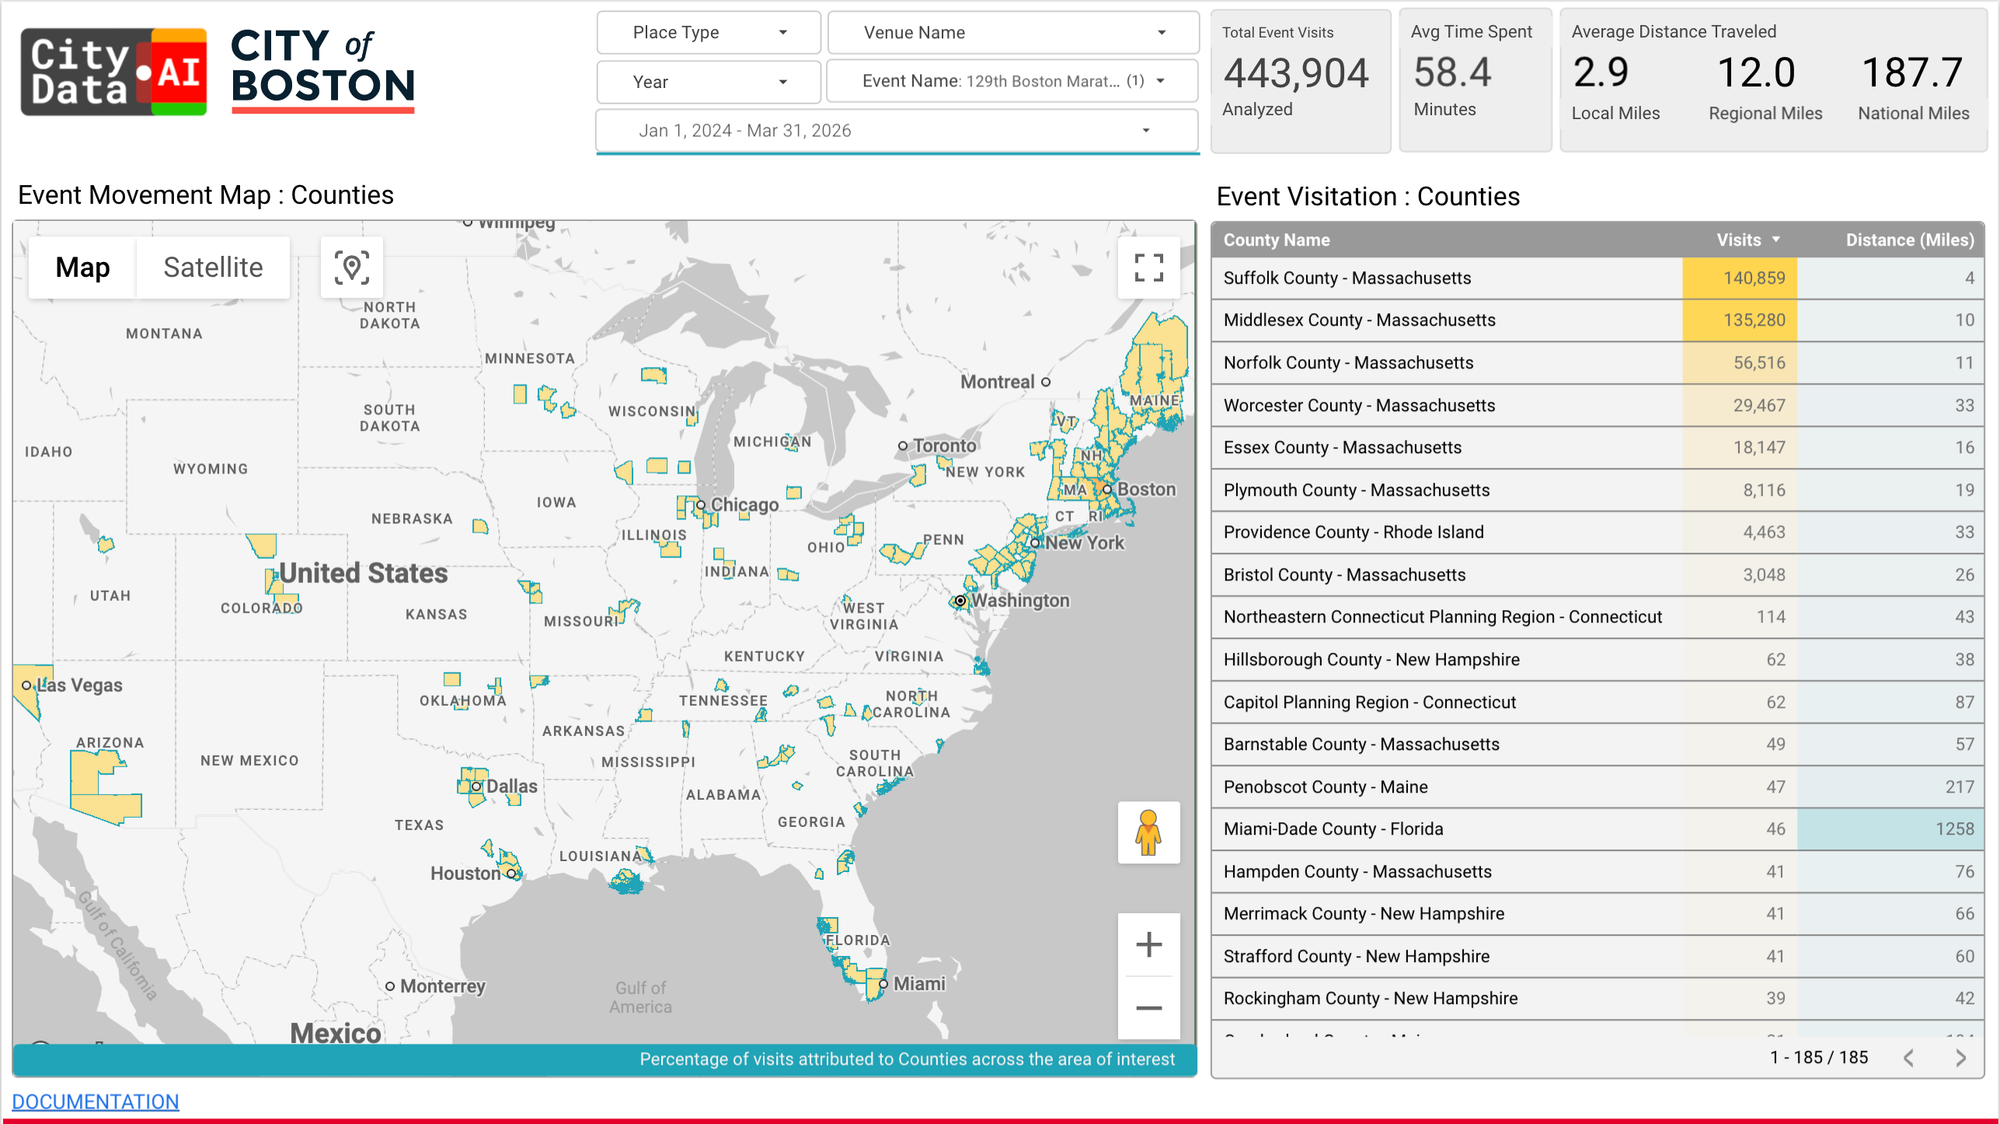
Nationwide Visitors (Counties):
Shifting to the broader county-level view, we capture a nationwide snapshot of mobility. The top origin locations are logically local Massachusetts counties: Suffolk County led with 140,859 visits, followed closely by Middlesex County with 135,280 visits. Norfolk County contributed 56,516 visitors, Worcester County added 29,467, Essex County brought 18,147, and Plymouth County saw 8,116.
The data also highlights the national draw of the marathon, tracking significant visitor volumes traveling from Hillsborough County, New Hampshire, and as far away as Miami-Dade County, Florida.
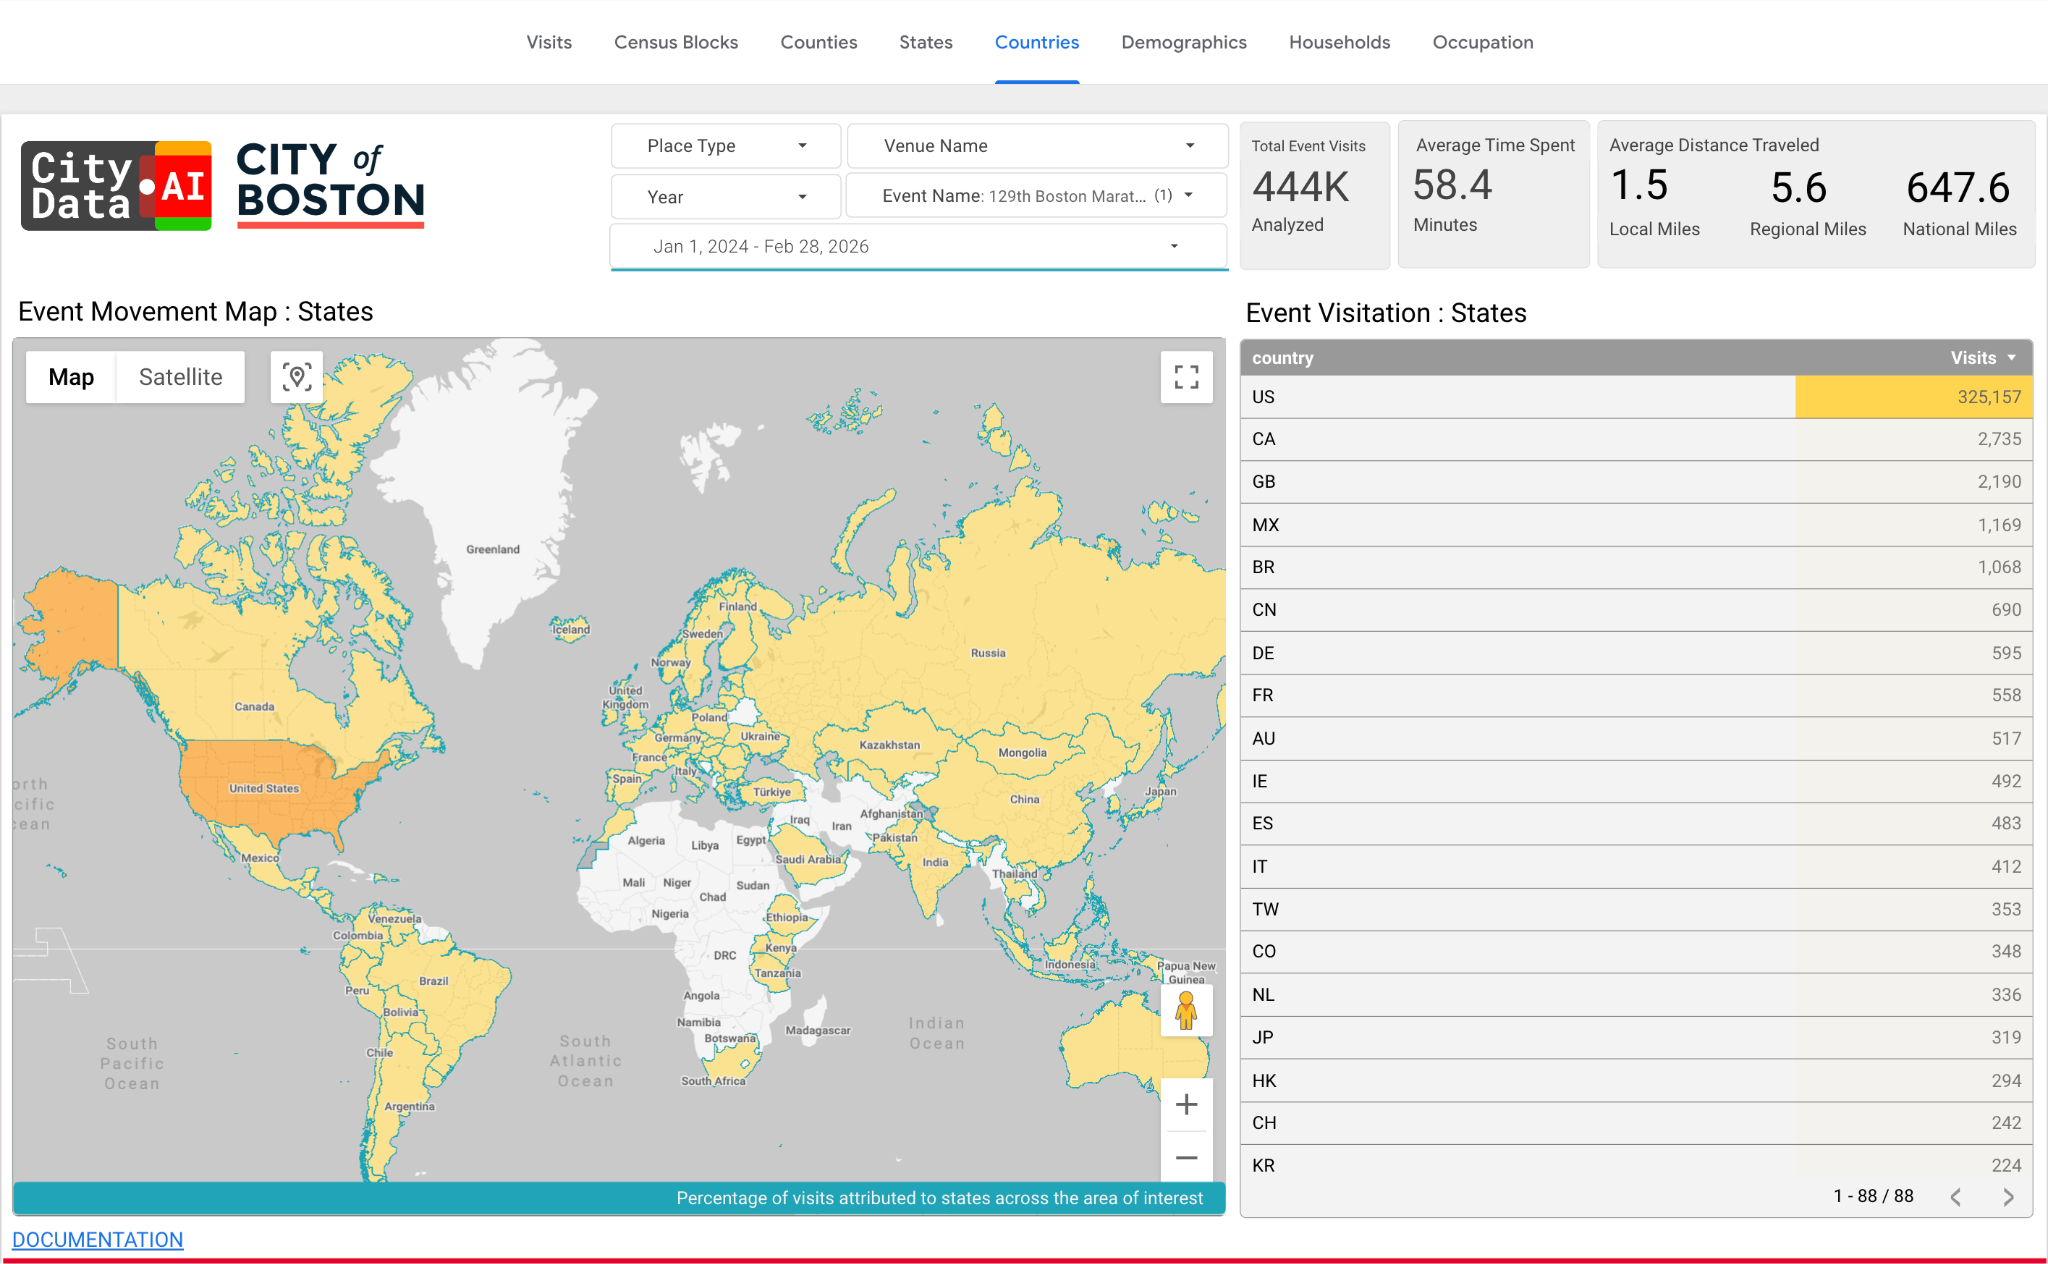
Global Origins (States & Countries):
The Boston Marathon is a world major, and our origin analysis definitively proves it. While the United States predictably dominated the origins with 429,197 visits, our system tracked significant international influxes directly back to their home nations.
Our dashboard recorded 2,190 visits originating from Great Britain (GB), 2,735 from Canada (CA), 1,169 from Mexico (MX), 1,068 from Brazil (BR), and hundreds more from China (CN), Germany (DE), France (FR), Australia (AU).
Economic Impact on Local Businesses
CityData measures the footfall visits to local businesses across +100 business and retail categories. The dashboard image below shows the cumulative footfalls to all POIs within Suffolk county a few days prior to the event, the week of the Marathon, and the post event wind down. The bars in blue represent the regular visits or baseline visits to the POIs. The stacked orange bars represent the increase in visitation from events. The chart shows clear increase in visits to local businesses during the week of the Boston Marathon.
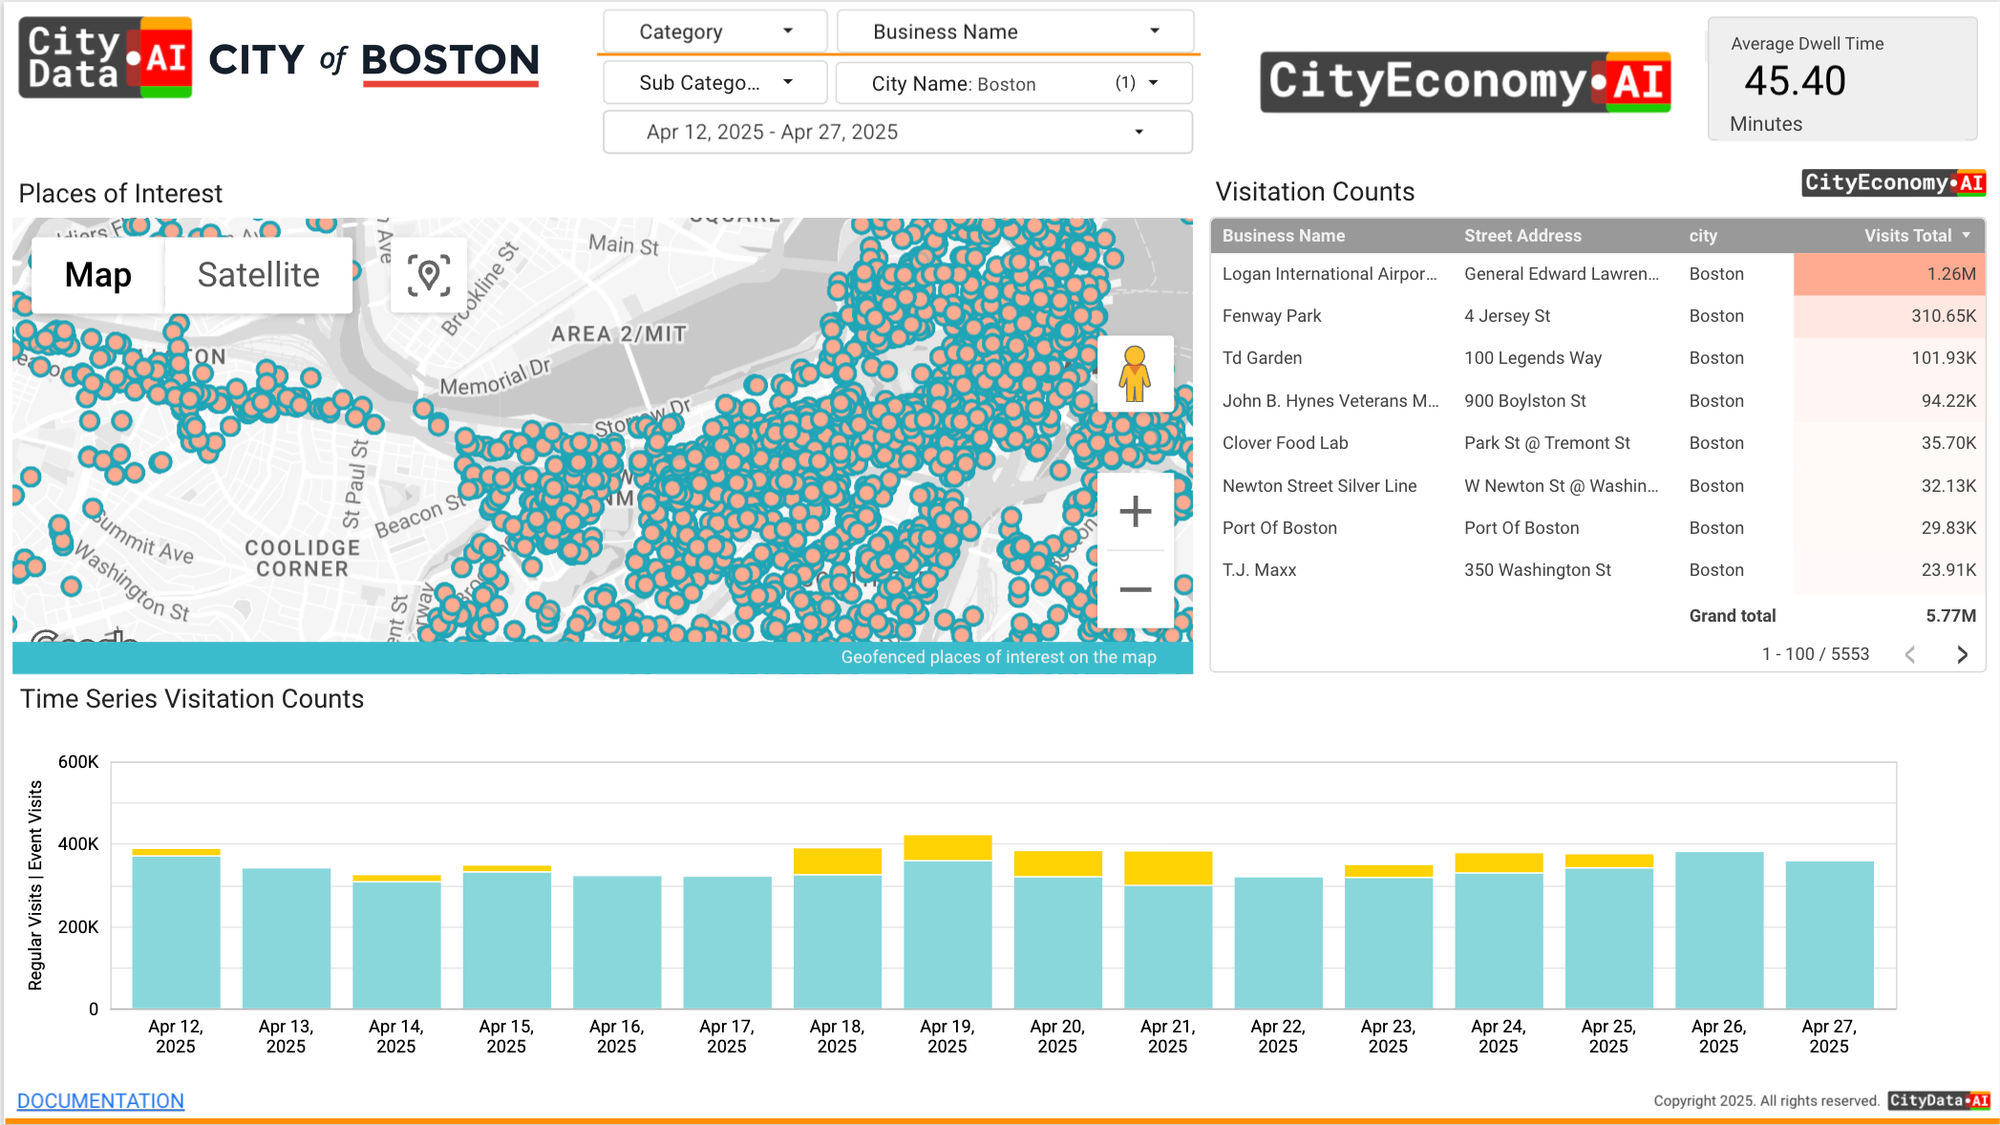
In the next step, we intend to correlate the visitation counts with anonymized and privacy-compliant transaction trends data derived from financial services companies to transform the footfall counts into spend estimates.
Conclusion
At CityData, measuring human movement for mega-events like the Boston Marathon requires more than just counting mobile device pings. By acknowledging structural data limitations and applying robust, population-aware distribution models, we ensure our customers receive mobility intelligence that is not only statistically rigorous but physically possible.