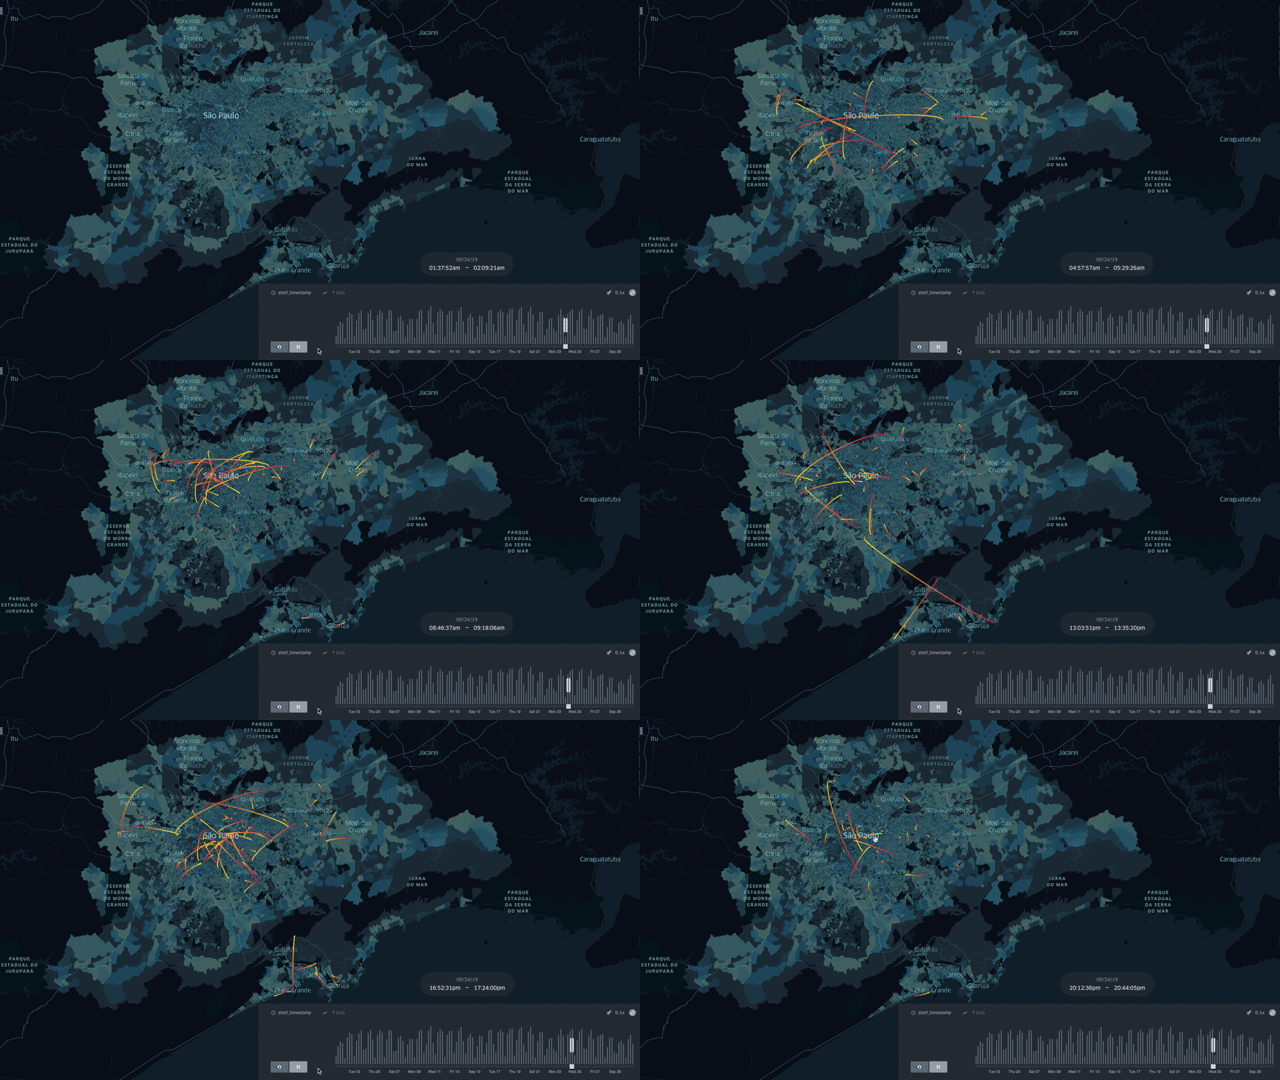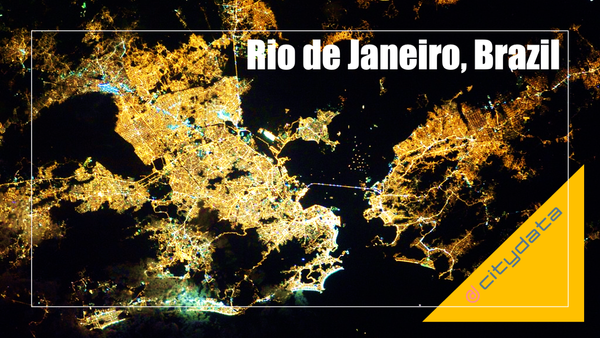
Mobility Trip Patterns for Rio de Janeiro, Brazil
> This blog posts delves into the mobility data and trip hop movement patterns for one of the largest metropolitan regions in Brazil. > Sign up for our webinars to learn from our
Collection of user stories, case studies, and customer testimonials published by CITYDATA.ai to benefit the ecosystem and foster innovation.
> This blog posts delves into the mobility data and trip hop movement patterns for one of the largest metropolitan regions in Brazil. > Sign up for our webinars to learn from our
> This blog post highlights the ready-to-use census open data with over +500 searchable demographic filters for the United States, Canada, Mexico, Brazil, Italy, Spain, UK, and Singapore, that can be joined with
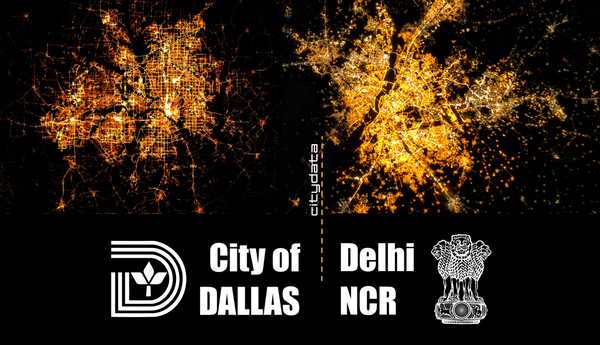
> This blog posts delves into the mobility data and trip hop movement patterns for the largest metropolitan regions in Texas and the largest metropolitan region in India. > Sign up for our
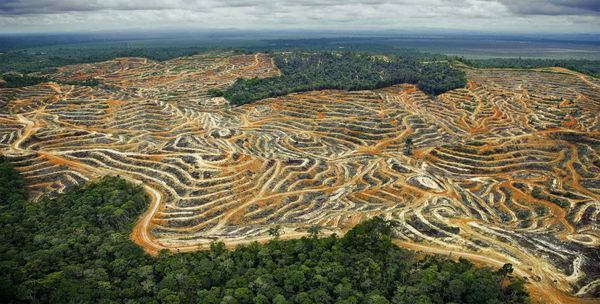
> This blog posts delves into the movement patterns between the palm oil plantations and the refinery mills in Sabah, Malaysia. > Sign up for our webinars to learn from our data scientists
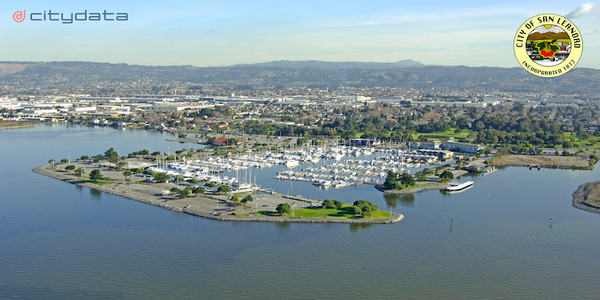
Citywide data insights dashboard spanning four departments and seven datasets for the City of San Leandro, California, USA CITYDATA.ai [http://citydata.ai/] has designed and developed a unified data analytics dashboard called
> This blog posts delves into the mobility data and trip hop movement patterns for one of the largest metropolitan regions in the United States. > Sign up for our webinars to learn
> This blog posts delves into the footfall data insights and visits trends for Scottsdale's McDowell Sonoran Preserve in Maricopa County, Arizona. > Sign up for our webinars to learn from
This blog post discusses the role of geospatial data for advocating and measuring the essential role of parks and recreational areas in and around cities and metropolitan areas.
The Data for Humanity initiative helps government agencies & health researchers with people movement analysis and geospatial dashboards related to COVID-19.
This blog posts uses live demos to explain how to measure and correlate people-movement patterns with COVID-19 propagation patterns.