Scaling Trip Counts From Sample to Population


Understanding city-wide mobility patterns is crucial for effective urban planning. CITYFLOW.ai leverages GPS mobility data to provide a powerful lens into these patterns. However, the data represents a sample of the population, not the entire city. This blog post delves into the technical process of scaling up trip counts from this sample to represent the full population within a given area. This involves a multi-stage process of data acquisition, residential inference, ratio calculation, and calibration using ground truth data.
1. Defining the Geographic Scope and Population Baseline:
The first step is establishing the geographical boundaries of the area under analysis. The level of granularity is crucial – too granular and we risk losing the bigger picture, too broad and we miss crucial local dynamics. Ideally, we use administrative or statistical boundaries published by national statistical agencies (e.g., Census Block Groups in the US). However, not all countries have readily available data at this level. In such cases, we might turn to alternative sources like OCHA (United Nations Office for the Coordination of Humanitarian Affairs) or reputable open-source shapefiles. The emphasis is always on high-quality shapefiles for accurate results.
Equally important is the population data corresponding to these geographic boundaries. Ideally, the population data should match the level of granularity of the chosen shapes. Often, however, population data is available only at a higher level (e.g., district level). In these situations, we employ disaggregation techniques, distributing the population to the smaller shapefiles based on relevant proxy variables. These proxies could be anything from voter registration numbers to building footprints – anything that provides a reasonable basis for proportional distribution.
Furthermore, population data can become outdated quickly, especially in rapidly developing areas experiencing significant growth (e.g., India). Therefore, we often need to project population figures to the current year. Again, we rely on trusted sources like national statistical institutes for growth rates and projections.
2. Inferring Residential Locations:
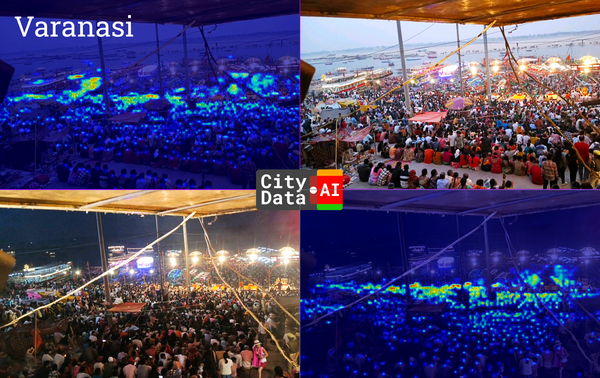
With the geographic framework and population baseline established, we turn to the CITYFLOW data itself. Our goal is to identify the residential locations of the devices within the dataset. This "residential inference" process uses the anonymized and clustered GPS data spanning several months, including the month for which we are scaling, to pinpoint the most likely home location for each device. We look for patterns of nighttime activity, identifying locations where a device spends a significant amount of time during nighttime hours, exceeding a certain threshold of days per week and weeks per month. If multiple locations meet these criteria, we select the one with the highest concentration of nighttime activity and label it as the "most likely residential neighborhood".
3. Calculating Daily Scaling Ratios:
Now, we can calculate the scaling ratio. We don't calculate a single monthly ratio, as CITYFLOW data can vary significantly from day to day. Instead, we calculate daily ratios. For each day, we count the number of "day-active residents" in CITYFLOW – devices whose residential location we've inferred and that show activity on that particular day. We then divide this count by the total population of the corresponding geographic area to obtain the daily scaling ratio. This ratio reflects the proportion of the population represented by the CITYFLOW data for that specific day.
It's important to note that we can't always infer a "most likely residential neighborhood" location for every device. For devices without an identified residential location, we use an average daily ratio. This average is calculated from all the daily ratios computed for devices with known residential locations.
4. Calibration with Ground Truth Data:
The scaling ratios provide a crucial link between the sample data and the population. However, they represent only the first step. To refine our estimates, we calibrate the scaled trip counts with ground truth data. This data comes from various sources, providing independent measures of traffic volume. Examples include tollway counts, bus passenger numbers, traffic counts at intersections, and even data from loop detectors.
Each ground truth dataset has its own specific characteristics and requires careful interpretation. Some data might be available at the shapefile level, while others might be more granular, down to the route level. The temporal availability also varies – some data might be daily, while others might only distinguish between weekdays and weekends.
Integrating ground truth data requires careful preparation of the CITYFLOW data to ensure compatibility. The extent to which we rely on ground truth data depends on its quality and how well its time period aligns with the CITYFLOW data.
5. Iterative Refinement and Data-Driven Insights:
Scaling and calibration are iterative processes. We continuously refine our methods as we acquire more data and gain a deeper understanding of the local context. Factors like weekly and daily traffic patterns, mode share, and special events all play a role. While publicly available data sources are invaluable, we sometimes need to supplement them with information from other sources, including AI-assisted tools, while exercising caution and critical evaluation of the generated data.
Ultimately, the accuracy of trip count scaling depends heavily on the availability and quality of data. The more data we have, and the more reliable that data is, the more confident we can be in the accuracy of our scaled estimates, leading to more informed transportation planning decisions.
About CITYDATA.ai
CITYDATA.ai brings mobility big data + AI to make cities smarter, sustainable, and more resilient. We provide insights about people counts, density patterns, movement trends, economic impact, and community engagement.
Founded in 2020 in San Francisco, California, CITYDATA.ai provides fresh, accurate, daily insights that are essential for smart city programs, economic development, urban planning, mobility and transportation, tourism, parks and recreation, disaster mitigation, sustainability, and resilience.
You can reach us via email at business@citydata.ai if you’d like to discuss your data needs and use cases. You can also follow the company on Linkedin, and the UniverCity.ai blog to stay updated on the newest innovations in big data and AI for the public sector.