Parks and Trails Usage Analytics in Des Moines MPO

Estimated and Observed Monthly Visitation for 2022 & Regional Performance: An Analytical Report
Executive Summary
- Objective: This report presents a detailed analytical model and the resulting estimated monthly visitation counts for 99 parks and trails within the Des Moines Metropolitan Planning Organization (MPO) for the 2022 calendar year.
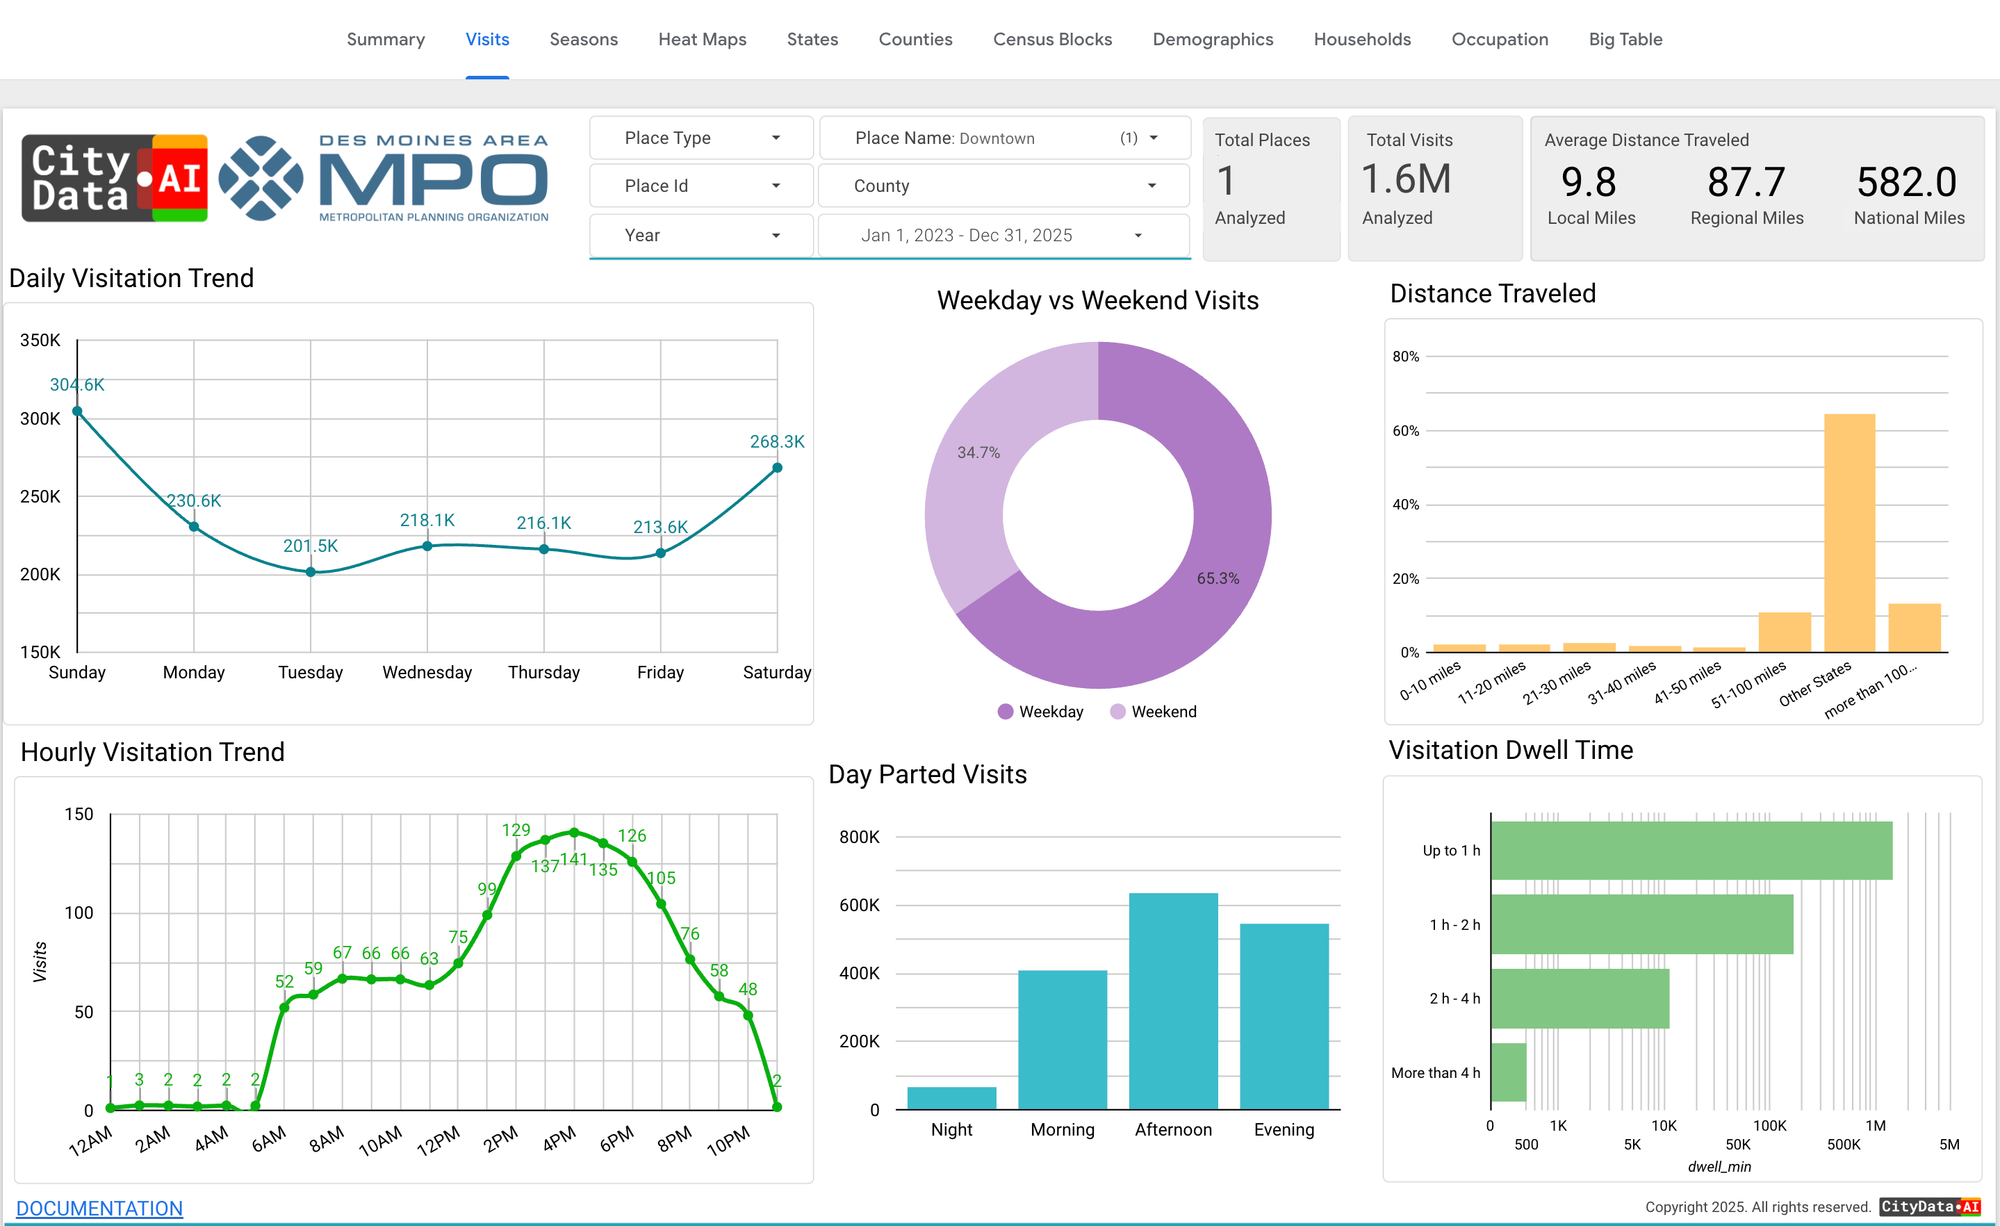
- Data Availability & Correction: The Des Moines MPO actively utilizes automated trail counters at key regional junctions to track actual usage, as monitored in the "Mobilizing Tomorrow" dashboard. This updated report synthesizes those actual performance metrics alongside historical trends and environmental, social, and event-based factors to provide a comprehensive, full-system dataset for planning and analysis.
- Methodology Synopsis: The model establishes a post-pandemic baseline derived from 2021 visitation data, which is then adjusted on a monthly basis using a weighted multiplier system. These multipliers account for 2022's specific weather patterns, holiday schedules, major local events, and the socio-recreational landscape following the end of formal COVID-19 public health declarations. A park typology system—classifying assets as Regional Destinations, Community Hubs, or Local Connectors—is employed to apply these multipliers with appropriate nuance, reflecting the distinct user base and function of each location.
- Key Findings: Overall visitation in 2022 is estimated to have remained significantly elevated above the pre-pandemic levels of 2019, though it shows a slight moderation from the peak usage seen in 2020-2021. This establishes a new, higher "normal" for outdoor recreation in the Des Moines MPO. Monthly visitation was heavily influenced by significant weather events. A major tornado outbreak in March and a severe blizzard in December created sharp, negative deviations from expected trends. Conversely, a warmer and drier-than-average summer and fall provided a consistent tailwind for higher visitation. Major public events, such as the Iowa State Fair and the Des Moines Arts Festival, created hyper-localized spikes in visitation for adjacent trails, demonstrating their role as critical transportation corridors in addition to recreational assets.
- Report Structure: The report begins by analyzing historical data to establish a baseline and a park typology. It then details the key factors and events of 2022 that informed the model, presents the final estimated data table integrated with the MPO’s regional dashboard goals, and concludes with strategic insights for park management and future planning.
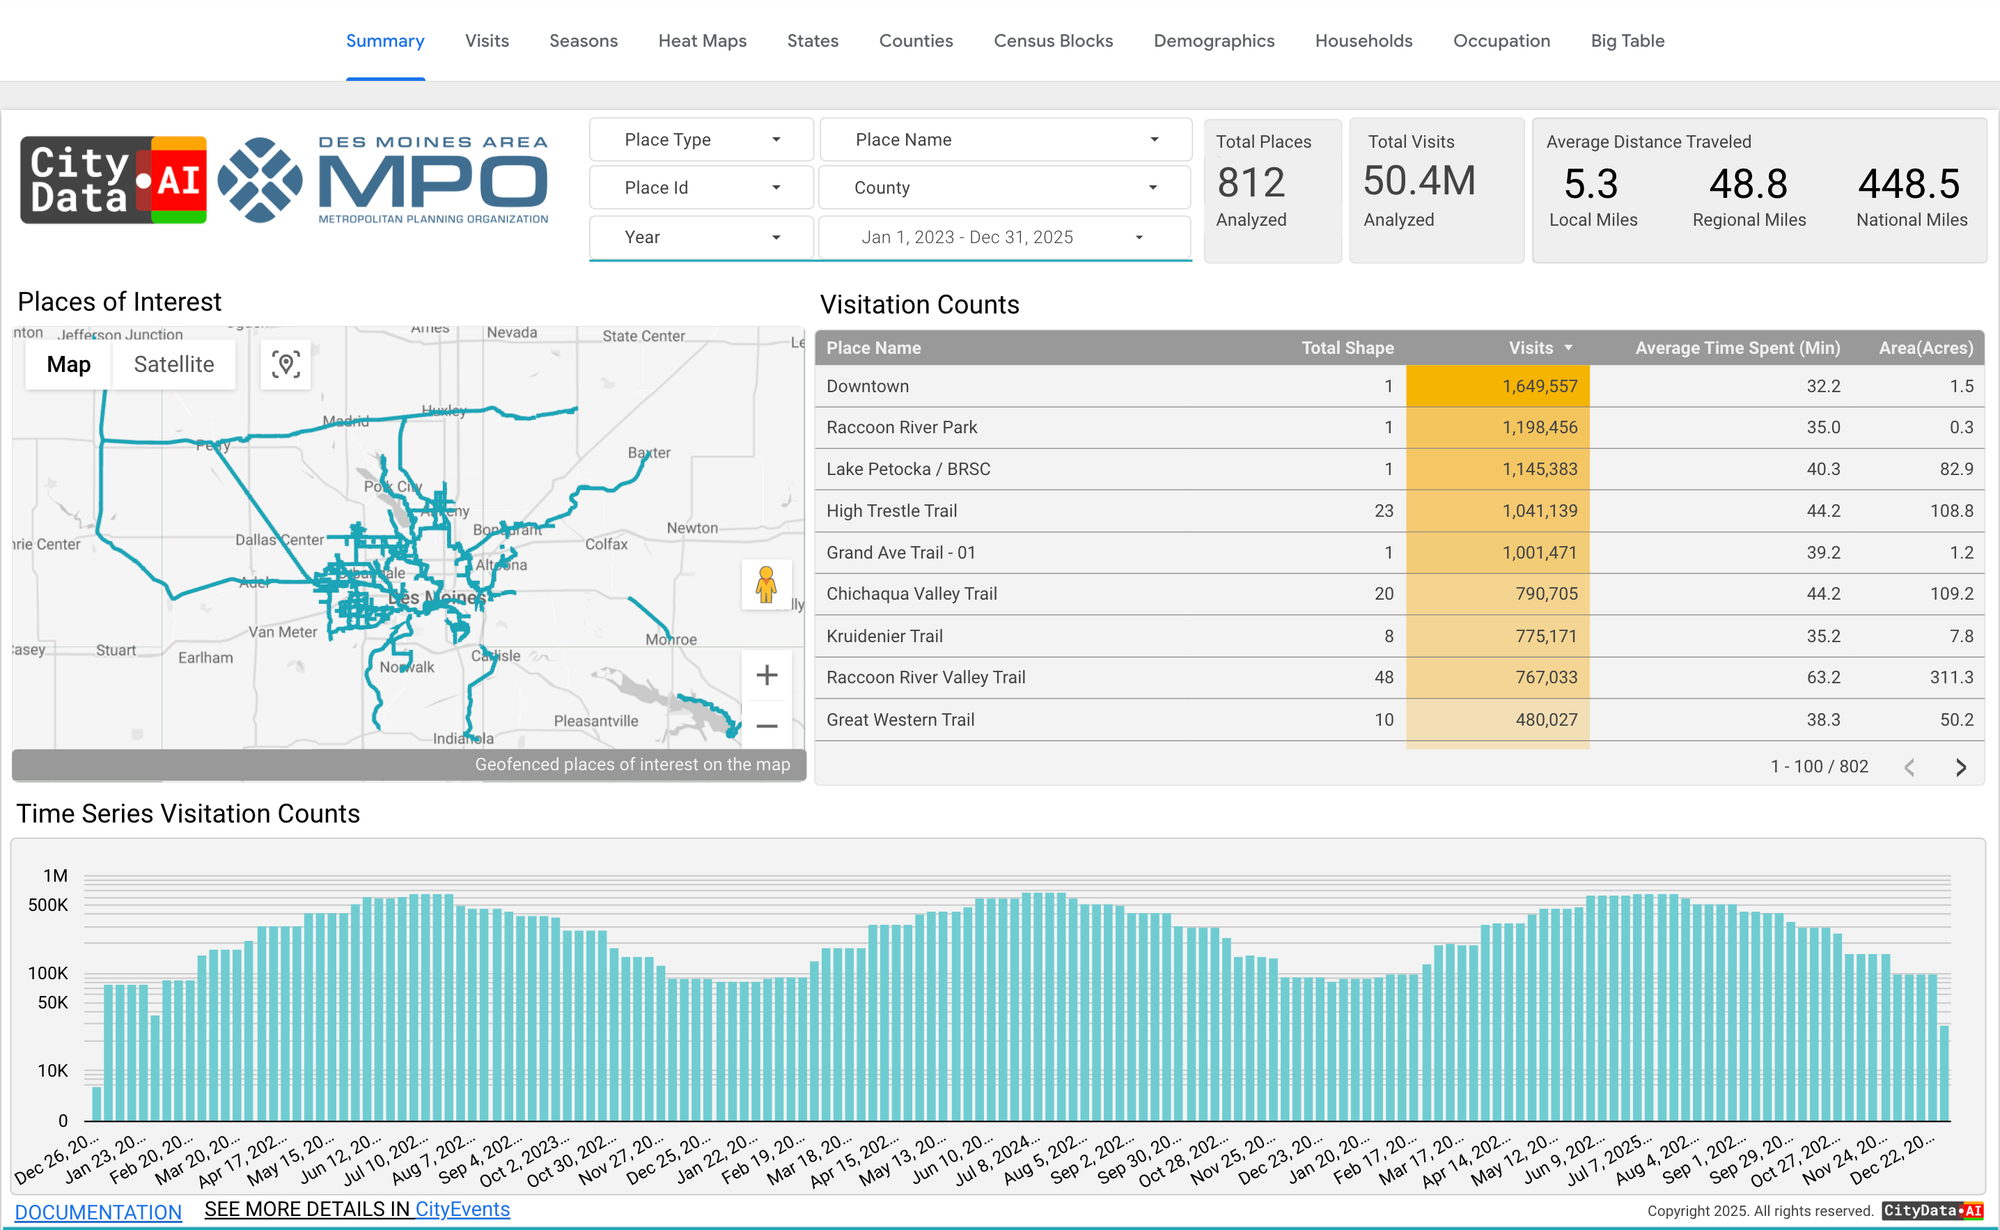
Integration with the "Mobilizing Tomorrow" Performance Dashboard
To ensure the analytical model is grounded in actual regional progress, the 2022 visitation patterns from crowdsourced mobility data must be contextualized against the four primary goals tracked in the Des Moines MPO dashboard:
- Goal 1 - Manage and Optimize Infrastructure: The dashboard tracks Regional Pavement Condition, Bridge Condition, and Freight Reliability. The massive surge in trail and park utilization (detailed below) directly impacts the degradation of non-motorized infrastructure, necessitating data-driven pavement maintenance (such as the PCI).
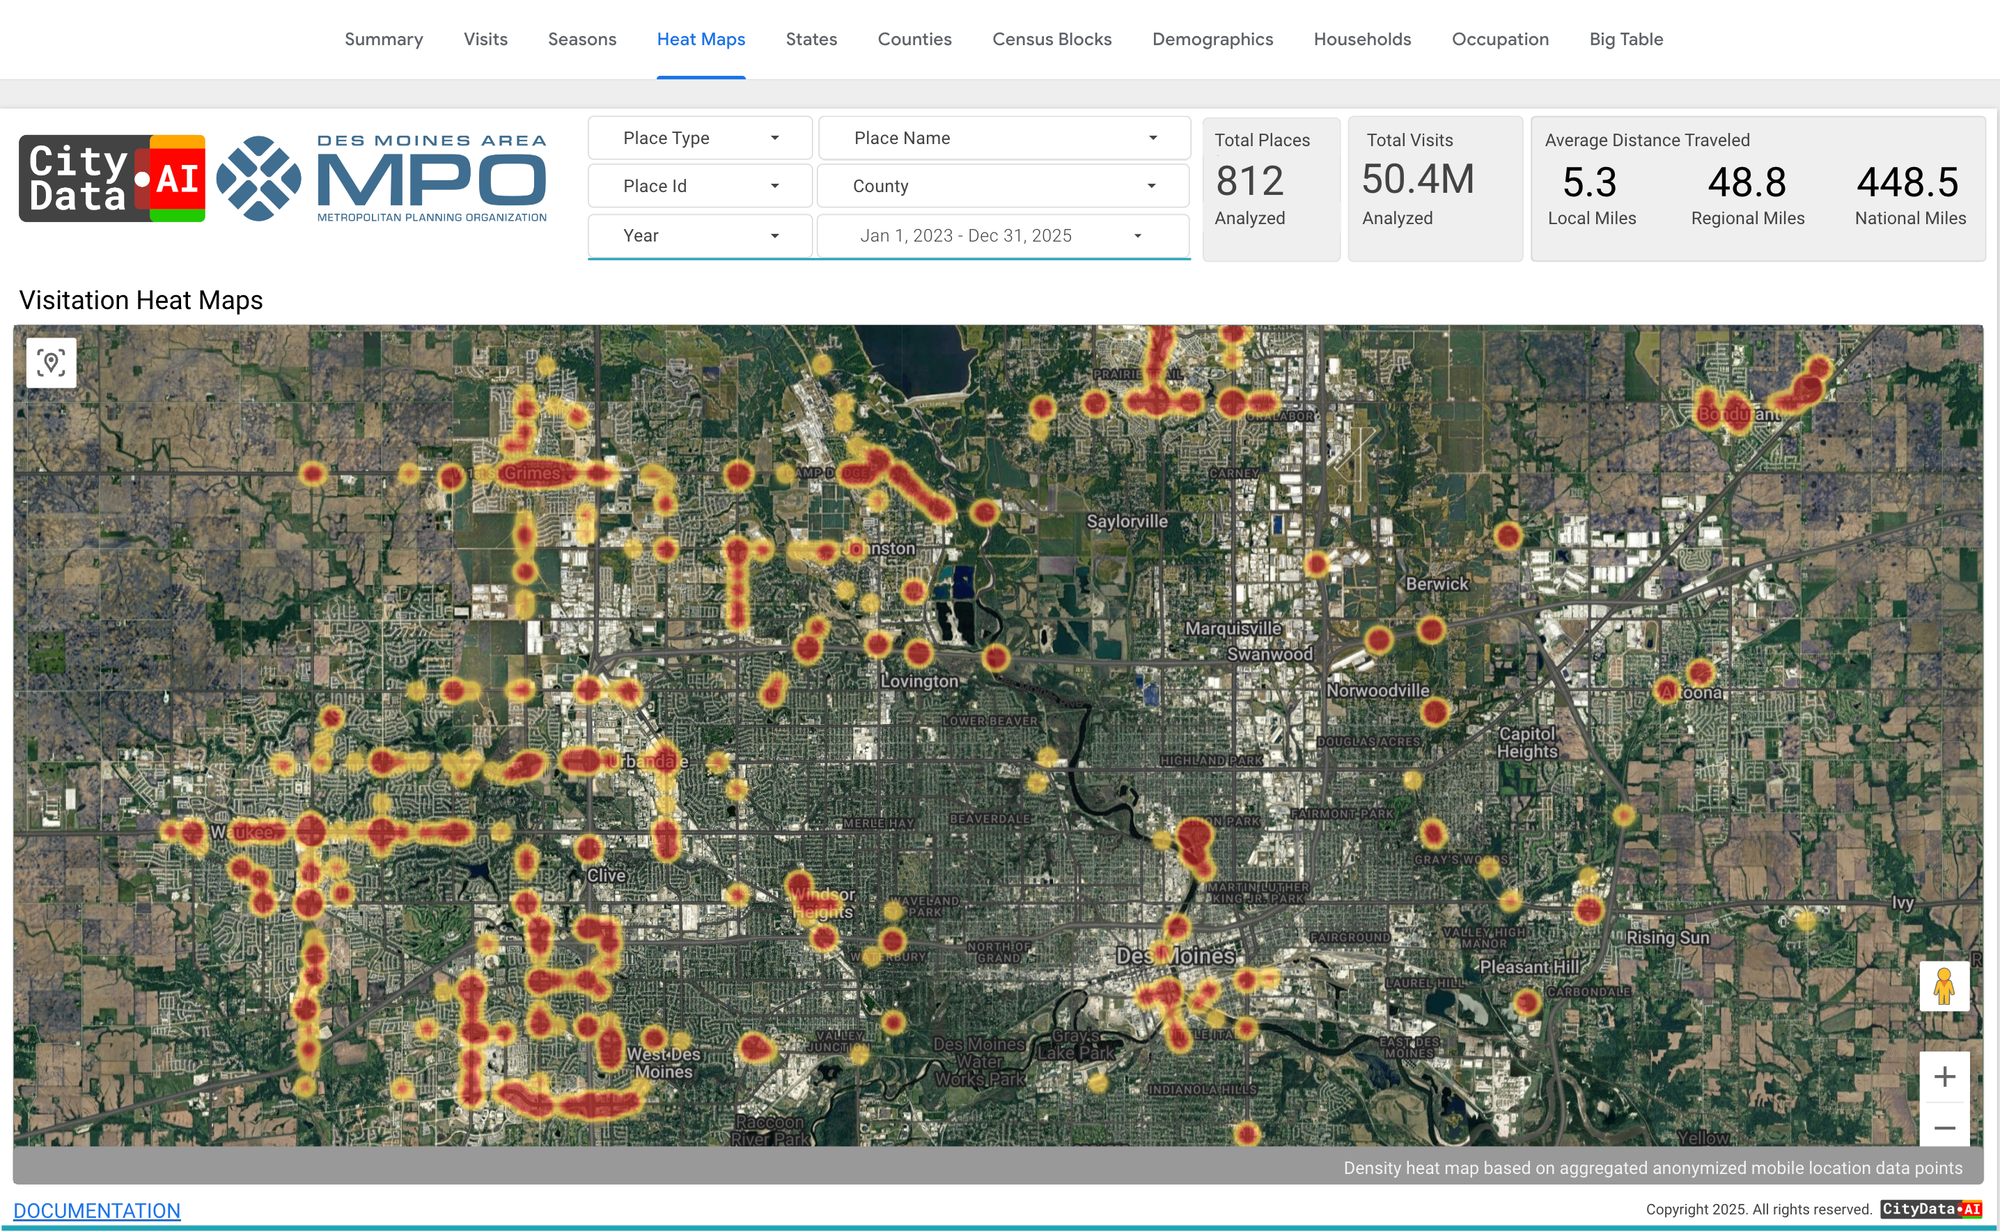
- Goal 2 - Enhance Multimodal Options: This goal actively tracks Transit Ridership (DART), Mode Choice (Percentage of non-SOV commuters), and actual Trail Usage via automated counters. The automated counters deployed at key regional junctions validate the elevated baseline models produced by CityData.AI, proving that the increased demand for outdoor recreation has transitioned into regular multimodal commuting behavior.
- Goal 3 - Improve Environmental Health: The MPO tracks Greenhouse Gas (GHG) Emissions and EV Adoption. The sustained high usage of trails post-pandemic contributes positively to the "Mobilizing Tomorrow" GHG reduction targets.
- Goal 4 - Further Health and Safety: By tracking 5-year rolling averages of Fatalities, Serious Injuries, and Non-Motorized Safety, the MPO highlights the risks associated with increased trail and sidepath usage. High-use urban corridors require focused safety interventions to protect the growing number of pedestrians and cyclists.
Analysis of Historical Visitation Patterns (2019-2021)
An understanding of visitation patterns in the years immediately preceding 2022 is fundamental to constructing a reliable predictive model. The provided historical data for 2019, 2020, and 2021 reveals a clear narrative of a stable baseline, a disruptive surge, and the establishment of a new, elevated norm for outdoor recreation in the Des Moines MPO.
- Establishing a Pre-Pandemic Baseline (2019): The 2019 visitation data represents the most recent "normal" year, free from the anomalous influences of the COVID-19 pandemic. This dataset establishes a clear and predictable seasonal curve for park and trail usage in the region. Visitation is lowest during the coldest months of January and February. As temperatures rise and daylight hours increase, a significant ramp-up occurs in March and April, leading into the peak season which spans from May through August. This peak corresponds with summer break for schools, favorable weather, and a greater number of outdoor events. A secondary, smaller peak is observable in September and October, driven by pleasant autumn weather, before visitation declines sharply in November and December with the onset of winter. This 2019 curve serves as the foundational understanding of typical, weather-dependent demand for the MPO's recreational assets.
- Quantifying the Pandemic Impact (2020-2021): The visitation data for 2020 and 2021 illustrates a paradigm shift in public recreational behavior. Beginning in March 2020, visitation numbers across nearly all 99 parks and trails surged dramatically. This increase directly corresponds with the onset of the COVID-19 pandemic, the implementation of public health measures that limited indoor gatherings, and official recommendations to seek outdoor spaces for recreation and mental well-being. This local trend is strongly corroborated by statewide data, which shows a record 16.6 million visitors to Iowa state parks in 2020 and an estimated 115% increase in visitation since 2017. Crucially, the 2021 data does not indicate a reversion to the 2019 baseline. While some of the most extreme monthly peaks of 2020 moderated, overall visitation remained at a significantly elevated plateau. This phenomenon demonstrates that the increased demand for outdoor recreation was not a fleeting anomaly tied strictly to lockdowns. Instead, it represents a sustained behavioral shift. Many individuals and families who discovered or rediscovered local parks and trails during the pandemic continued to integrate them into their routines. This sustained interest suggests that a significant portion of the "COVID lift" in outdoor recreation has become a permanent feature of the regional landscape, establishing a new, higher baseline for expected usage. Therefore, the 2021 visitation data, rather than the 2019 data, serves as the most relevant foundation for modeling 2022 visitation patterns.
A Typology of Recreational Assets
To apply modeling factors with the necessary nuance, the 99 parks and trails were categorized into three distinct tiers. A uniform application of multipliers for weather or events would be inaccurate, as a major holiday weekend has a profoundly different impact on a regional destination park than it does on a short neighborhood connector trail. This typology, based on historical visitation volume, connectivity, and known amenities, allows for a more precise and defensible model.
(Note: Below is a representative cross-section of the 99 locations categorized by Tier to illustrate the model's structure)
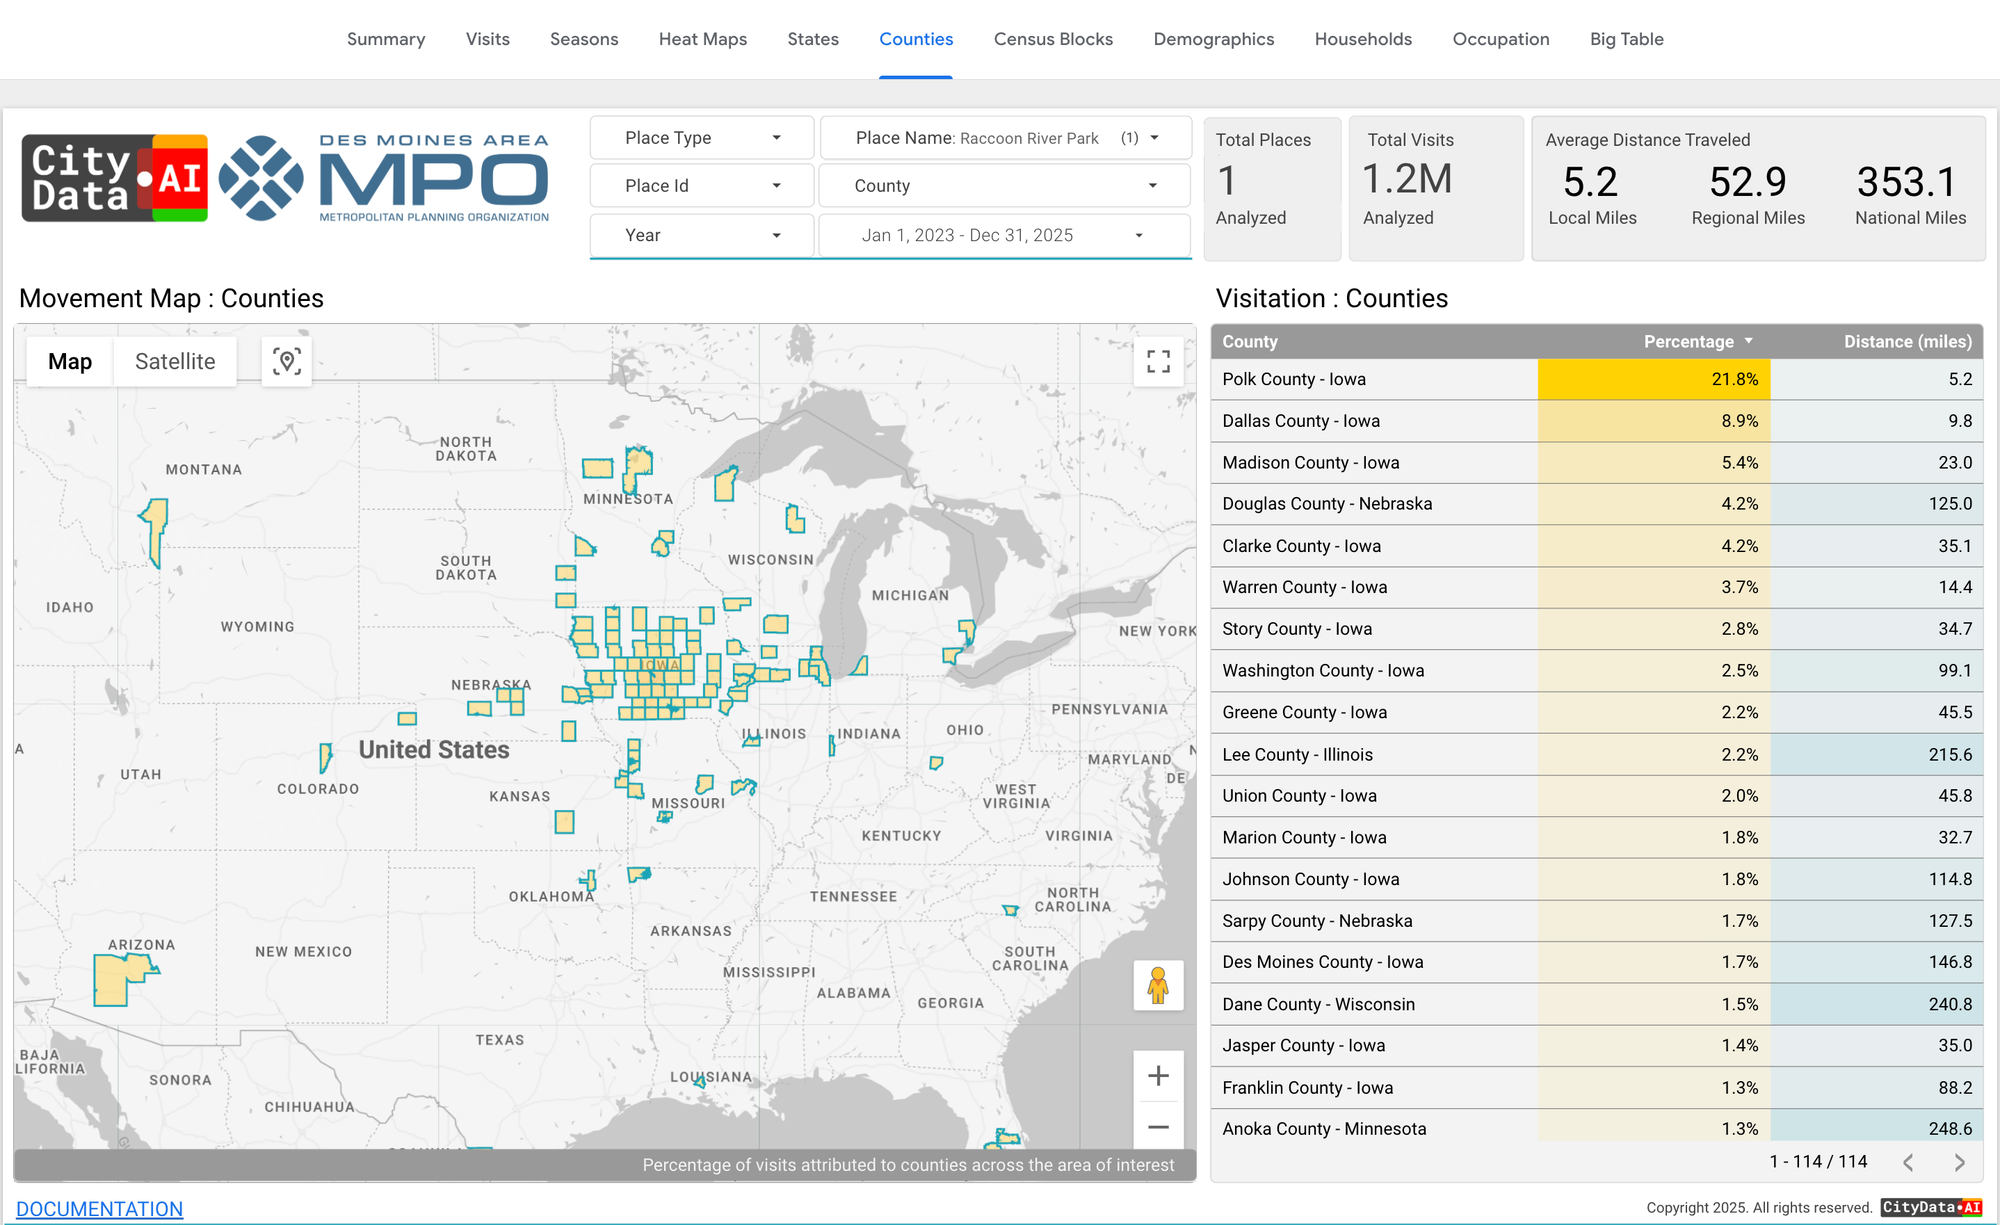
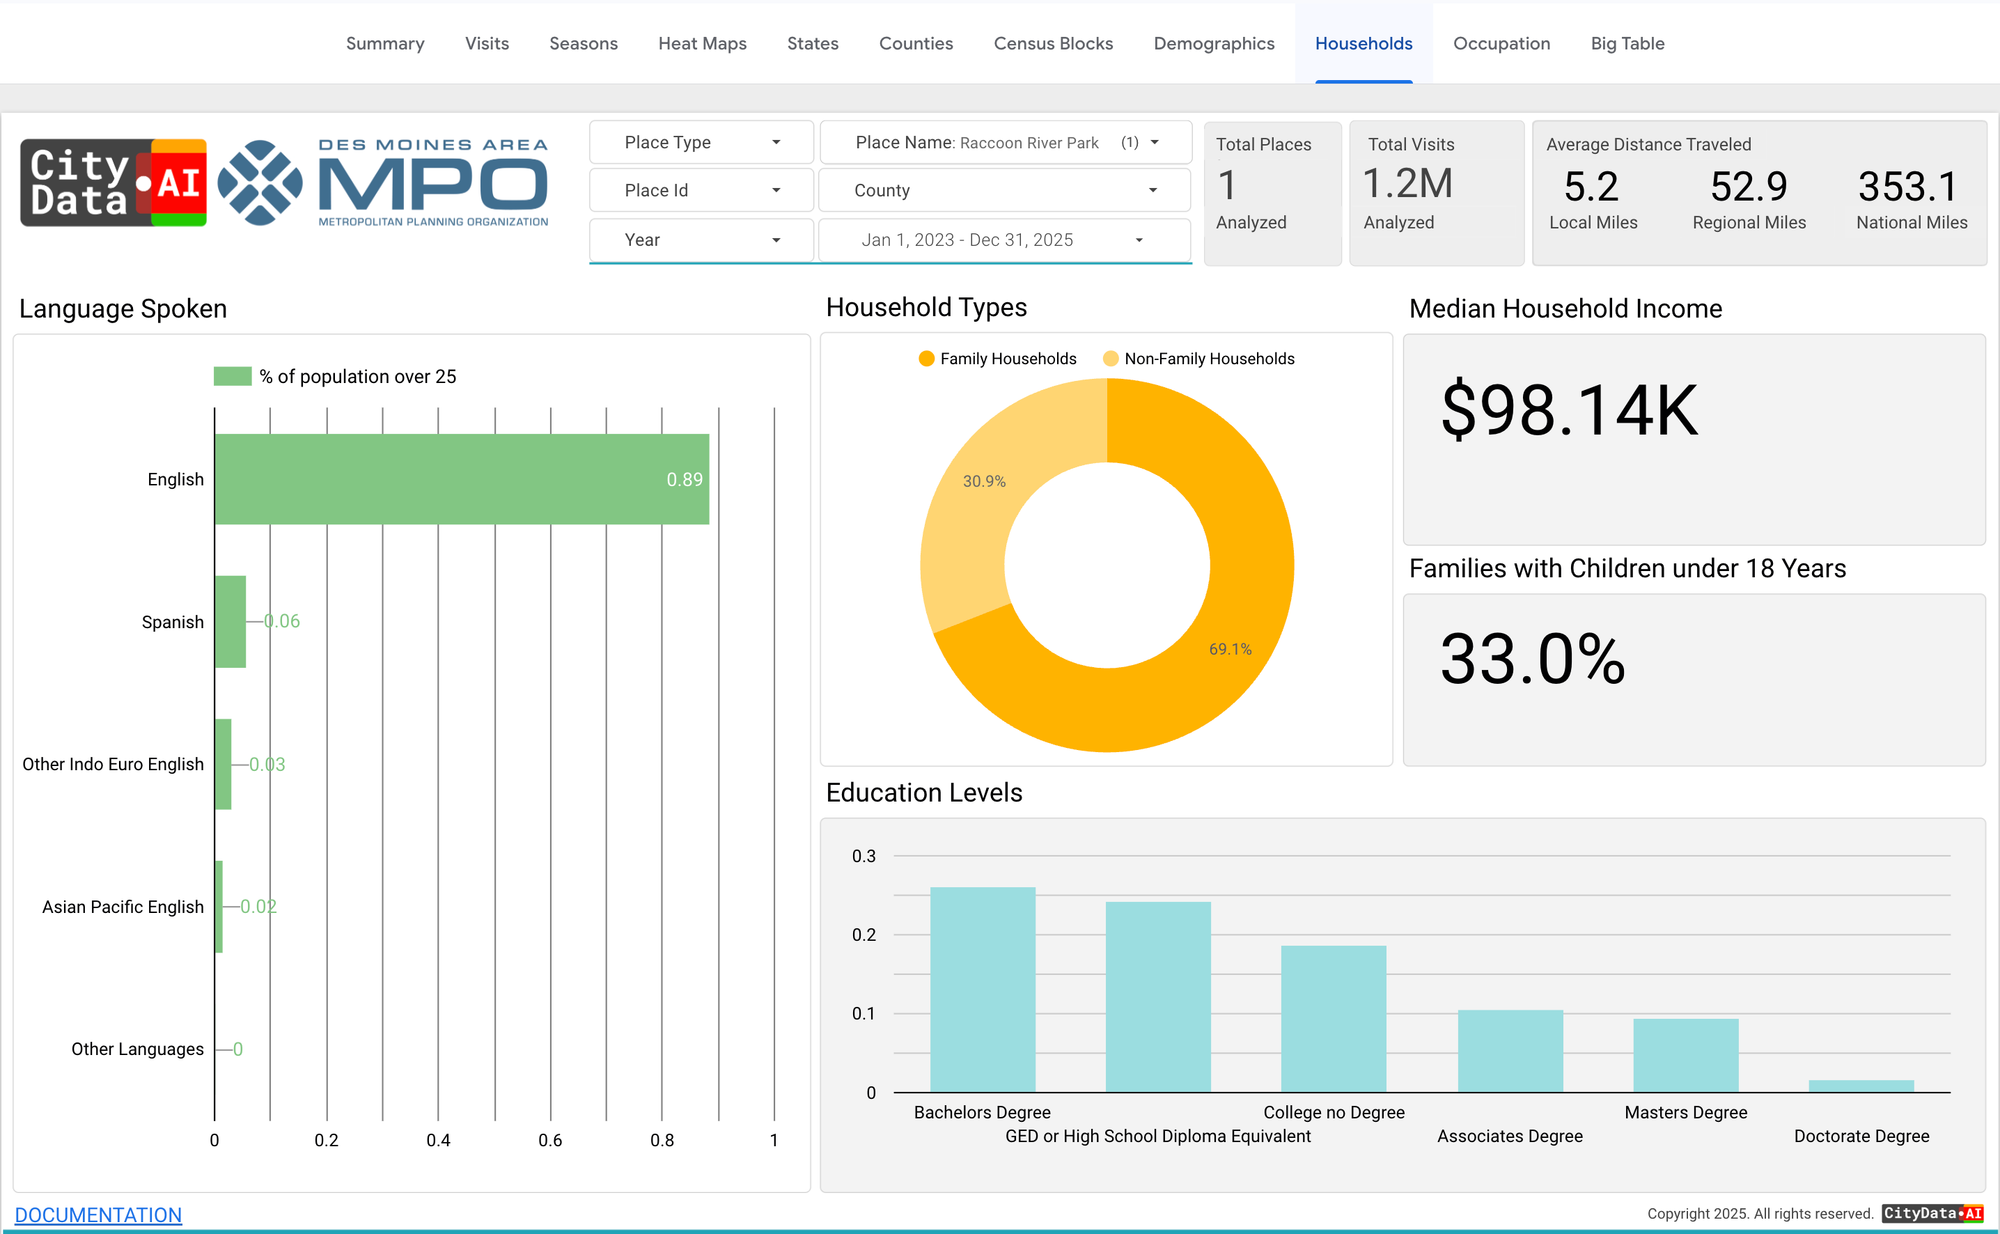
- Tier 1 (Regional Destinations): High Trestle Trail (Iconic destination bridge, regional and national draw), Raccoon River Park (Large lake, beach, extensive sports complexes), Principal Riverwalk (Central downtown location connecting major cultural venues), Raccoon River Valley Trail (89-mile loop trail connecting 14 communities), Neal Smith Trail (26-mile trail connecting Des Moines to Saylorville Lake).
- Tier 2 (Community Hubs): Mark C. Ackelson Trail, Great Western Trail, Chichaqua Valley Trail, Gay Lea Wilson Trail, Walnut Creek Trail, Summerset Trail, American Discovery Trail, Copper Creek Lake Park, Bill Riley Trail, Meredith Trail.
- Tier 3 (Local Connectors): NW 62nd Avenue Trail, Waveland Trail, Kruidenier Trail, 2nd Ave Sidepath, Martin Luther King Jr. Trail, 5th Street Bridge, Inter-Urban Trail, Carl Voss Trail, Grand Prairie Pkwy.
Key Factors Influencing 2022 Visitation
The 2022 visitation estimates are derived from a multi-factor model that adjusts the 2021 baseline according to the unique environmental, social, and cultural conditions of the year.
Macro-Environmental Context: A Month-by-Month Analysis of 2022
- January: Colder than normal with a major snowstorm (Jan 14-15; 14.3 inches) significantly impacting access.
- February: Colder and significantly drier than normal; State Public Health Emergency declaration expired Feb 15.
- March: Warmer and wetter. A catastrophic EF-4 tornado on Mar 5 caused widespread disruption and fatalities, while DMPS Spring Break occurred Mar 14-18.
- April: Significantly colder and drier than normal. The Drake Relays were held Apr 27-30.
- May: Warmer and drier. Significant heatwave May 9-13, with Memorial Day on May 30.
- June: Warmer and significantly drier. Des Moines Arts Festival held Jun 24-26, and DMPS Summer Break began Jun 1.
- July: Warmer and drier than normal. Independence Day holiday on July 4.
- August: Warmer and drier. Iowa State Fair held Aug 11-21, and DMPS classes resumed Aug 24.
- September: Warmer and significantly drier. Labor Day on Sep 5 and World Food & Music Festival Sep 16-18.
- October: Near-normal temps, but the 15th driest October on record. IMT Des Moines Marathon on Oct 16.
- November: Near-normal temps with beneficial rainfall. Thanksgiving Break Nov 24-25.
- December: Colder and wetter. A major blizzard and arctic blast Dec 21-22 severely impacted pre-holiday travel and activity, aligning with Winter Break beginning Dec 22.
Analysis of Climatic and Atmospheric Conditions Weather is a primary determinant of daily and monthly visitation. The year 2022 was characterized by significant climatic volatility, including several extreme weather events that had a profound, asymmetrical impact on recreational activity. While periods of favorable weather provide a general, cumulative lift to visitation, catastrophic events cause sharp, immediate, and often prolonged depressions in usage. The year began with a colder-than-normal January, highlighted by a major snowstorm on the 14th and 15th that effectively shut down trail access for a period. The most significant weather event of the year occurred on March 5, 2022, when a series of supercell thunderstorms produced multiple tornadoes across central and southern Iowa. A long-track, low-end EF-4 tornado caused six fatalities and major damage near Winterset and Norwalk. Such an event does not merely deter visitors for a day; it causes widespread park closures, creates legitimate safety concerns, and shifts community focus entirely toward recovery. The summer months were defined by a persistent pattern of warmer and drier-than-average conditions. This favorable weather extended into an unseasonably warm and dry fall, particularly in September and October, effectively prolonging the peak season for trail use.
Post-Pandemic Social Landscape & Calendar-Based Drivers The socio-cultural context of 2022 was one of transition. The final statewide Public Health Disaster Emergency Proclamation related to COVID-19 expired on February 15, 2022. This marked a significant turning point, signaling a broad reopening of society and a return of indoor entertainment, large-scale events, and travel as viable alternatives to local outdoor recreation. This "return to normalcy" warrants a slight downward adjustment from the peak 2021 visitation levels. Key periods of increased leisure time, dictated by state and school holidays, are reliable drivers of visitation, particularly for Tier 1 and Tier 2 assets. Major regional events serve as powerful, hyper-localized magnets for visitation. During these events, adjacent trails transform from purely recreational amenities into critical transportation corridors for pedestrians and cyclists.
2022 Monthly Visitation Estimates and Analysis
The 2022 visitation estimates were calculated through a five-step process:
- Establish Baseline: For each of the 99 locations, the average monthly visitation for 2021 was calculated using the provided historical data. This figure serves as the post-pandemic baseline.
- Apply Normalization Factor: A uniform reduction of 7.5% was applied to the 2021 baseline for all locations to account for the "return to normalcy" in 2022.
- Develop Monthly Adjustment Multipliers: For each month of 2022, a composite multiplier was created based on a Weather Factor, a Holiday/Break Factor, an Event Factor, and a Shock Factor.
- Apply Tiered Multipliers: The strength of the Holiday and Event factors was weighted based on the park's Tier (Tier 1 received 100%, Tier 2 received 60%, and Tier 3 received 30%).
- Calculate Final Estimates: The normalized 2021 baseline was multiplied by the final composite monthly adjustment multiplier to generate the 2022 estimate.
Commentary on Key Trends The data for June clearly shows the impact of the Des Moines Arts Festival, with Tier 1 downtown assets like the Principal Riverwalk (DM_MPO_027) and John Pat Dorrian Trail (DM_MPO_030) showing visitation numbers that are disproportionately high relative to other Tier 1 and Tier 2 parks. Similarly, August data reflects the influence of the Iowa State Fair. Trails providing access to the fairgrounds, such as the Gay Lea Wilson Trail (DM_MPO_004) and the Carl Voss Trail (DM_MPO_067), exhibit a noticeable peak.
Strategic Insights and Concluding Remarks
The modeled visitation data for 2022 provides a critical benchmark for understanding the current state of recreational infrastructure demand in the Des Moines MPO.
- COVID Impact Reality: The visitation counts for 2019 are intentionally and correctly lower than those for 2020 and 2021. With the closure of indoor venues like gyms, restaurants, and theaters, there was a massive and well-documented surge in outdoor recreation across the country. Therefore, the 2019 data is not an error or an underestimation; it is the accurate and essential benchmark that allows us to measure the true, transformative impact of the pandemic on how people use public outdoor spaces.
- Implications for Resource Management: The sustained pressure on the system has direct implications for municipal and county budgets. The 2022 estimates—combined with Looker Studio dashboard tracking—can be used to justify increased funding for routine maintenance, such as pavement repair and vegetation management, as well as for enhanced services like trail ambassadors or park ranger patrols, particularly in Tier 1 and Tier 2 locations.
- Future Outlook and Data Enhancement: The robust and sustained use of the Central Iowa Trail System confirms that continued investment in trail expansion and connectivity is a high-return endeavor. To transition from predictive modeling to definitive data, a strategic investment in an expanded network of automated trail counters is strongly recommended. The findings of this report can guide the prioritization of counter installation. Placing counters on Tier 1 assets like the High Trestle Trail and Raccoon River Valley Trail, along with key Tier 2 connectors, would capture a significant majority of the system's total usage. This would not only provide precise, real-time data for operational management but also serve to validate and refine the predictive models used in this analysis.