The Ideal Take-off and Landing Spots for eVTOLs

A Scientific Approach to Vertiport Site Selection for Urban Air Mobility using CITYSIM
Imagine a future where buzzing electric vehicles weave through cityscapes, whisking passengers between rooftops. This vision of Urban Air Mobility (UAM) promises to revolutionize transportation, but its success hinges on strategically placed vertical take-off and landing locations, also known as "Vertiports" for electric aircraft.
Mobility big data and agent-based mesoscopic simulators like CITYSIM offer a powerful combination of tools to identify optimal locations, ensuring efficient and well-connected UAM networks. This blog delves into the scientific process of 10 steps for selecting logical vertiport sites in urban and suburban areas by studying, analyzing, and clustering ground transportation flow data.
Step 0: Understanding the eVTOL Aircraft Parameters
The typical eVTOL has a range of 150 kilometers. The first step is to discuss with manufacturers and operators to collect data about the UAM fleet that will operate within the city. This includes parameters like aircraft range, capacity, cycle time, maximum speed, cruise speed, charging time, and capacity.
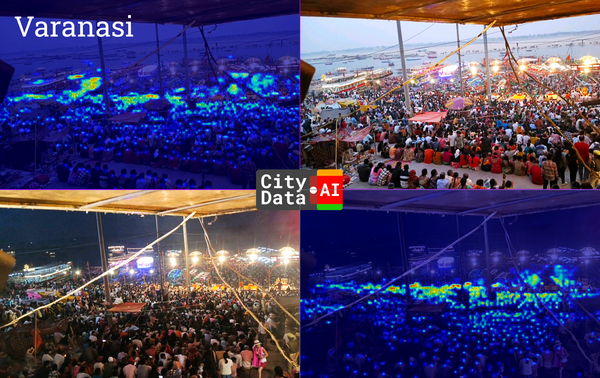
Step 1: Capturing the Movement Flow of the City
Our journey begins by gathering 6 to 12 months of high-resolution crowdsourced mobility GPS data from sensors, apps, and connected vehicles. This data paints a detailed picture of travel patterns within the city, revealing the origin and destination points for countless trips. We identify the trips and trip segments. We sort through the origin and destination points for individual trips. We identify the route trajectories, speed, distance, and travel time. We also infer the travel modes like walking, cycling, driving, and public transit. The resulting dataset is called CITYFLOW and can include billions of rows of trip data. CITYFLOW data is typically hosted in cloud data stores like Google BigQuery for ease of analysis.
Step 2: Mapping the Aerial Landscape
Next, we calculate the crow-flight distance between the origin and destination points in. This distance represents the potential travel time for UAM vehicles, taking into account their operational range.
Step 3: Defining the Boundaries of Flight
Considering the limitations of eVTOL range, the overall size of the city, and the distances between populated areas, we establish minimum and maximum flight distances for analysis.
Step 4: Setting the Time frame (Optional)
UAM operations might have specific time constraints based on vehicle capabilities or regulations. We can optionally define a range of hours for analysis, factoring in sunrise/sunset times for optimal visibility.
Step 5: Filtering for Relevant Journeys
With boundaries established, we filter the city flow data. Only trips falling within the predefined distance and time window (if applicable) are retained for further analysis.
Step 6: Identifying Potential Landing Zones
From the filtered data, we extract all origin and destination locations. These points represent potential areas of high demand, where vertiports could be strategically positioned.
Step 7: Clustering the Take-off and Landing Points
Here's where the magic of data science unfolds. We employ a clustering algorithm called DBSCAN. This powerful tool groups geographically close locations together, revealing clusters that represent areas with concentrated travel demand – ideal zones for vertiport development.
Fine-tuning the Clusters for Optimal Placement
- Min_Samples: This parameter sets the minimum number of data points required to be considered a cluster. Adjusting this value allows us to find clusters with varying densities, catering to different UAM network needs.
- Epsilon: This parameter defines the maximum distance between two points for them to be considered within the same cluster. We convert this value from radians to kilometers, ensuring accurate distance-based clustering.
Step 8: Evaluating the Clustering Landscape
Multiple iterations with different min_samples and epsilon values are executed. We evaluate the resulting clusters using the Silhouette coefficient, a metric that measures how well a data point is assigned to its cluster. Higher values indicate a more accurate clustering.
Step 9: Mitigating Overlap and Refining Results
Clusters might overlap, indicating areas with exceptionally high demand. We address this by:
- Removing clusters with excessive overlap.
- Merging overlapping clusters into one larger zone.
- Selecting the dominant cluster and removing smaller, overlapping ones.
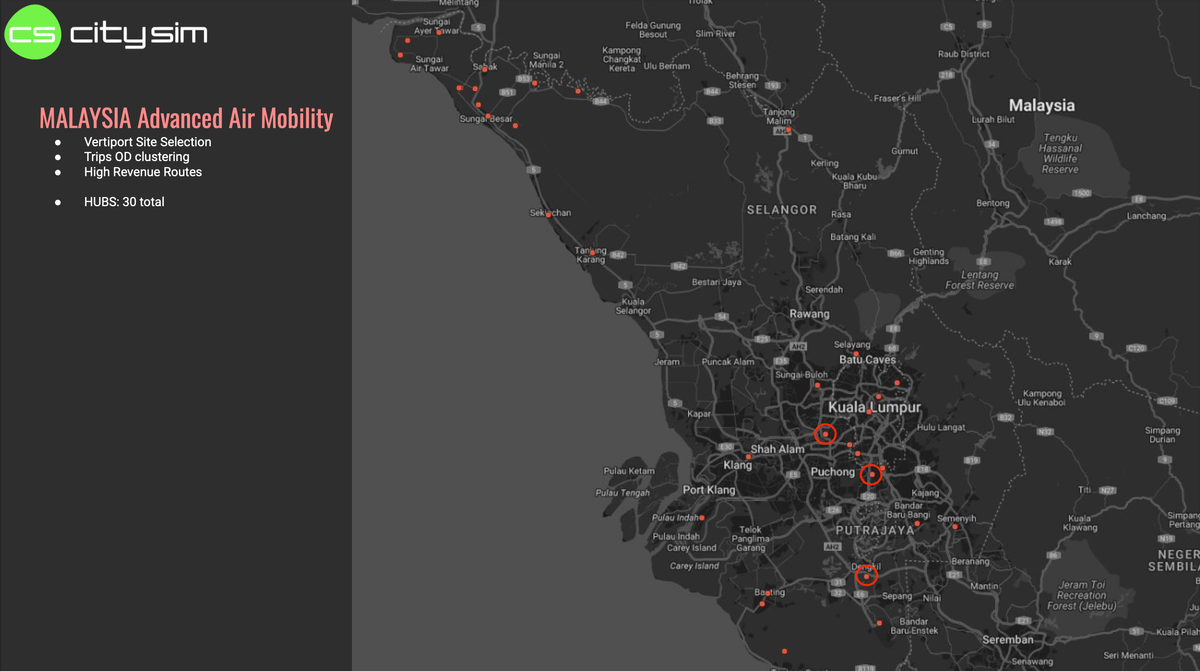
Step 10: Selecting the Prime Landing Spots
Based on the size of the analyzed area, we identify the top 3-5 clusters as potential vertiport locations. These zones represent the optimal landing spots, strategically placed to cater to the highest travel demand within the city.
By following these data-driven steps, we can unlock the true potential of UAM. Vertiport clustering analysis empowers us to select optimal locations, paving the way for a seamlessly connected and efficient urban air mobility network.
By harnessing the power of big data analysis, vertiport clustering analysis unlocks valuable insights for shaping the future of urban air mobility. This data-driven approach helps us identify strategic locations for vertiports, optimizing passenger convenience and paving the way for a seamlessly connected urban airspace.
About CITYDATA.ai
CITYDATA.ai brings mobility big data + AI to make cities smarter, safer, and resilient. We provide insights about people counts, density patterns, movement trends, economic impact, and community engagement.
Founded in 2020 in San Francisco, California, CITYDATA.ai provides fresh, accurate, daily insights that are essential for smart city programs, economic development, urban planning, mobility and transportation, tourism, parks and recreation, disaster mitigation, sustainability, and resilience.
You can reach us via email at business@citydata.ai if you’d like to discuss your data needs and use cases. You can also follow the company on Linkedin, and the UniverCity.ai blog to stay updated on the newest innovations in big data and AI for the public sector.