Analyzing Events Using Crowdsourced Mobility Data

The New Science of Transforming Mobility Telemetry into Real-World Event Intelligence
For decades, urban planners, event organizers, and emergency management directors operated in a world of educated guesses. Understanding human movement traditionally relied on a patchwork of analog methodologies: manual turnstile clicks, scattered ticket sales, post-event surveys, and aerial photography. While these methods offered a snapshot in time, they completely lacked the dynamism, granularity, and accuracy required to truly understand the modern city.
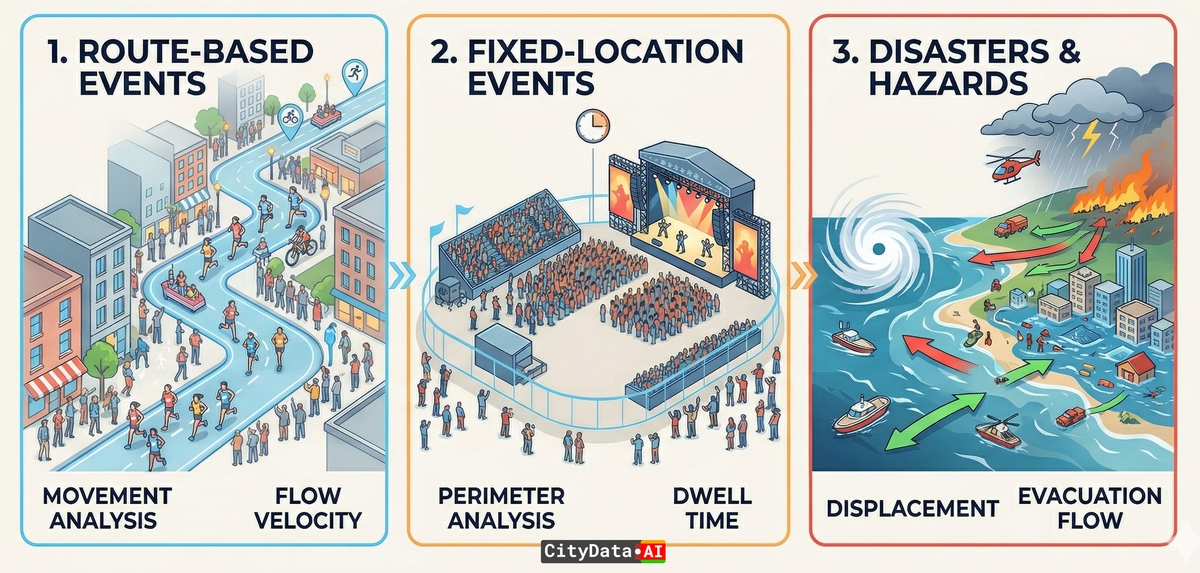
At the highest level, events in the real-world can be categorized into:
1. Route-Based Events
2. Fixed-Location Events
3. Disasters and Hazards
Let's dive deeper into the three categories
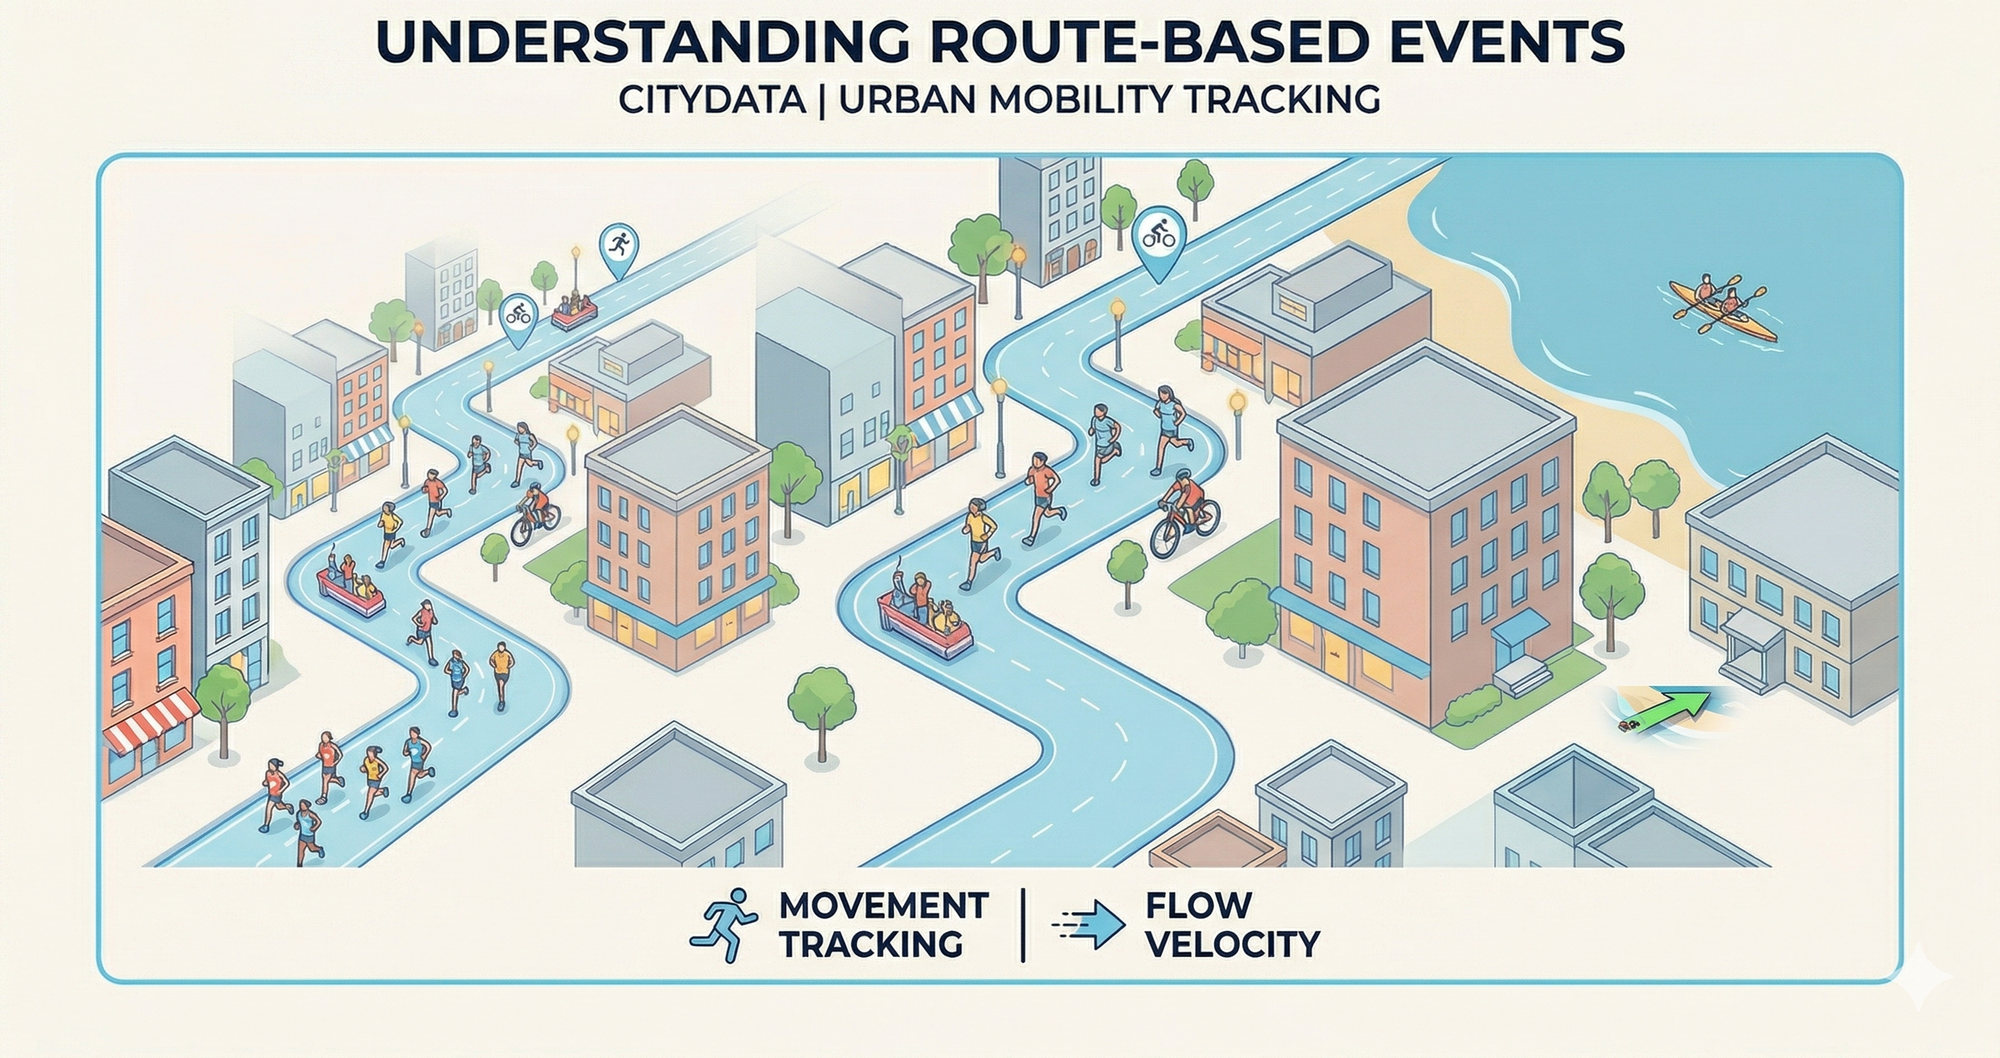
1. Route-Based Events
These events are defined by continuous movement from a starting point to an endpoint, requiring dynamic traffic and crowd control.
- Competitive Races: Marathons, 5Ks, 10Ks, and organized street runs.
- Cycling Competitions: Road races, charity bike rides, and professional tours.
- Parades: Civic celebrations, holiday parades, and pride events with floats and marching bands.
- Marches: Political demonstrations, awareness campaigns, and protest movements moving through city streets.
- Processions: Religious walks, ceremonial marches, and large-scale funeral processions.
- Motorcades: VIP or dignitary transport, police-escorted convoys, and charity motorcycle rides.
- Relays: Torch runs, baton relays, and multi-day team distance events.
- Triathlons & Multi-sport Races: The portions of the event that span public roadways or open water.
- Organized Pub Crawls & Walking Tours: Large, permitted groups moving sequentially between venues on foot.
- Aquatic Route Events: Boat parades, flotillas, and regattas that follow a specific path along a river or coastline.
2. Fixed-Location Events
These events take place within a defined perimeter or venue, focusing on capacity management, access control, and stationary logistics.
- Festivals: Multi-day or single-day music, food, cultural, or film festivals.
- Conventions & Expos: Trade shows, fan conventions (e.g., Comic-Con), and industry conferences.
- Concerts & Live Music: Stadium tours, amphitheater shows, and park concerts.
- Stadium & Arena Sports: Football, basketball, soccer, and other traditional sporting events held within a venue.
- Stationary Rallies: Political rallies, demonstrations, and vigils held in a single public square or park.
- Street Fairs & Block Parties: Neighborhood events where streets are closed, but participants remain within the closed grid.
- Public Markets: Farmers markets, holiday markets, and large-scale outdoor flea markets.
- Corporate Events: Galas, holiday parties, product launches, and networking mixers.
- Ceremonies: Graduations, inaugurations, and televised award shows.
- Private Social Gatherings: Large-scale weddings, family reunions, and private VIP parties.
- Carnivals & State Fairs: Events featuring amusement rides, agricultural exhibits, and midway games.
- Art Exhibitions: Museum installations, large-scale gallery openings, and immersive art experiences.
- Esports Tournaments: Competitive gaming events hosted in arenas or dedicated broadcasting venues.
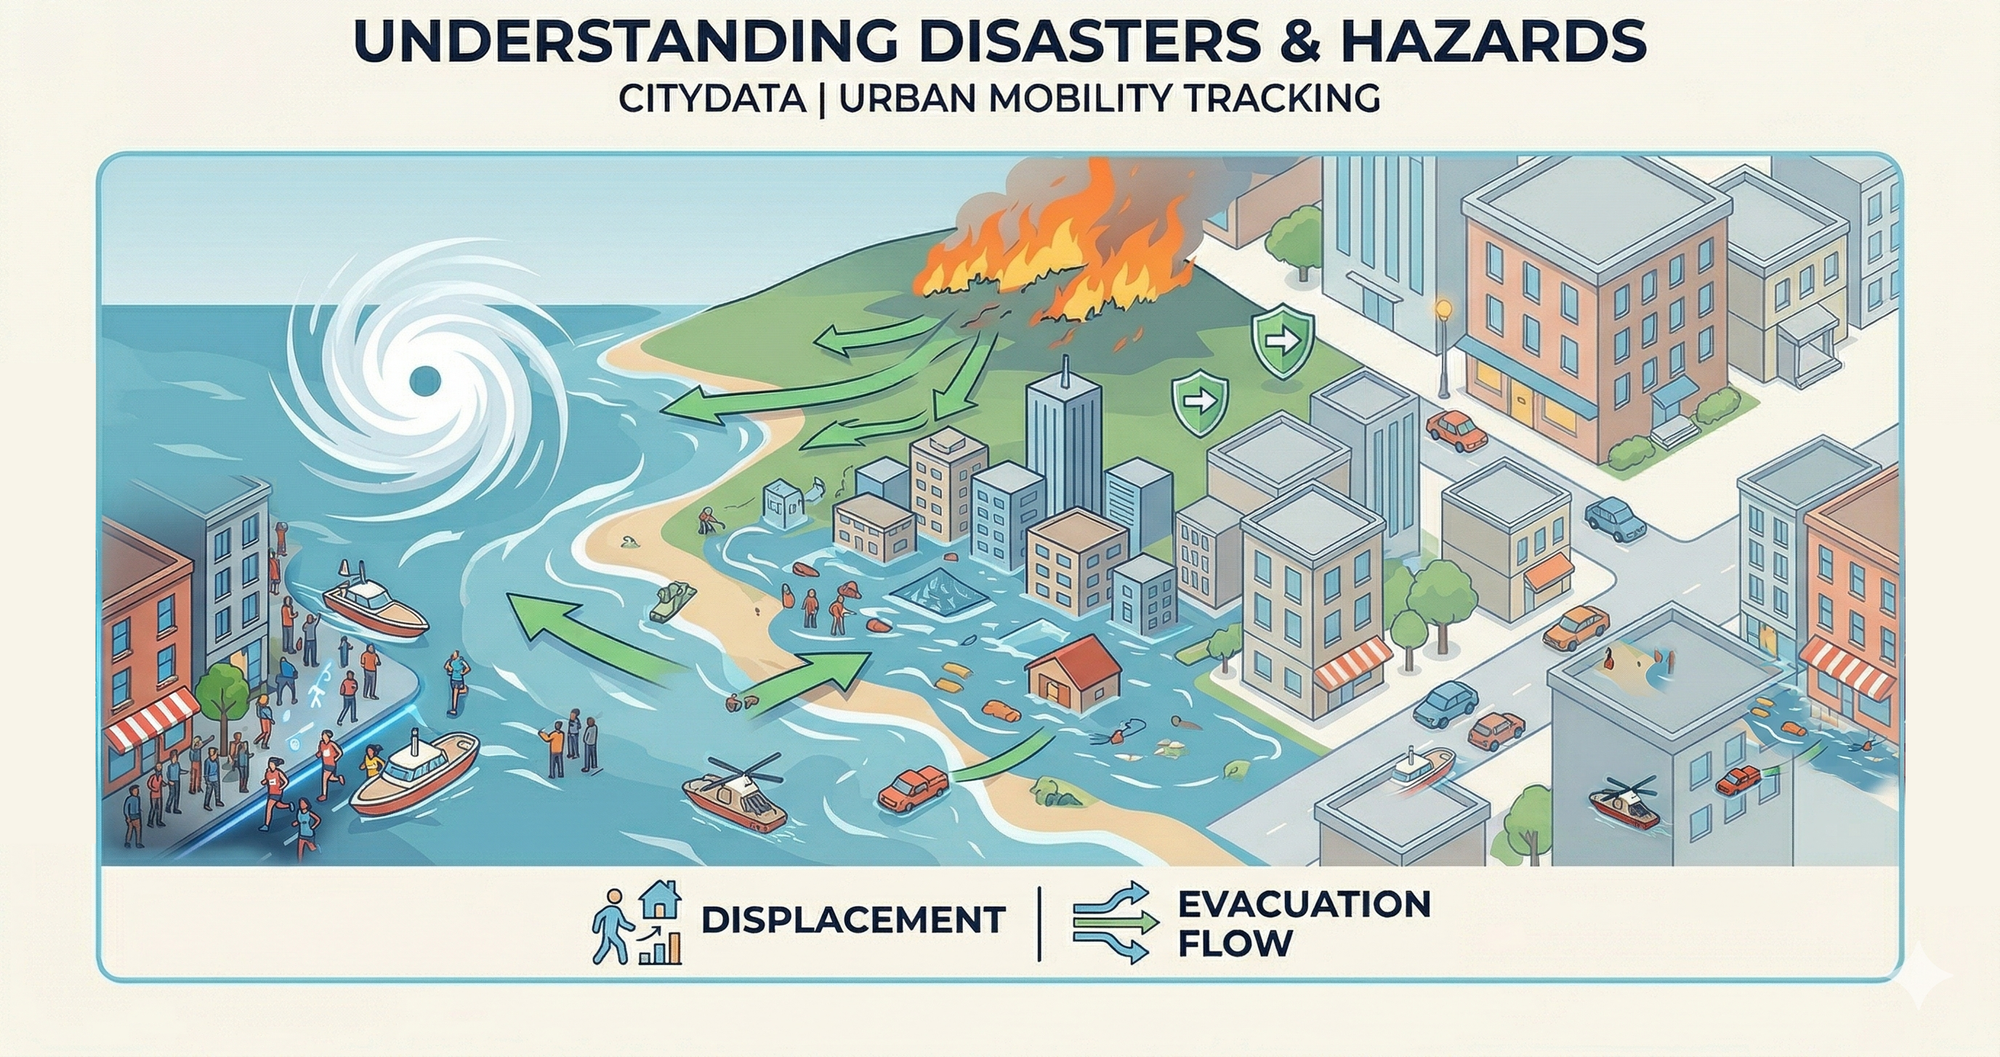
3. Disasters and Hazards
While planned events are categorized by their movement and footprint, natural disasters and human-caused hazards belong in a completely different classification. In emergency management and disaster response, these are usually categorized by theirorigin or cause (the scientific mechanism behind them), as this dictates how emergency services predict, prepare for, and respond to them.
3.1 Geophysical (Earth-Driven)
These events originate from solid earth mechanisms and are notoriously difficult to predict with exact timing, making rapid response their defining characteristic.
- Earthquakes: Seismic events requiring immediate structural rescue, infrastructure assessment, and management of aftershocks..
- Tsunamis: Massive displacement of water, usually triggered by underwater earthquakes, requiring rapid coastal evacuation and high-ground staging.
- Volcanic Eruptions: Involving lava flows, toxic gas, and ashfall, requiring broad evacuation zones and regional airspace closures.
- Landslides & Mudslides: Ground failures (often triggered by heavy rain or seismic activity) requiring localized, highly technical search and rescue.
- Avalanches: Sudden releases of snow down a mountainside, requiring specialized alpine rescue protocols.
3.2 Meteorological (Weather-Driven)
These events are atmospheric. They can often be tracked and predicted days or hours in advance, shifting the focus to mass communication, pre-staging resources, and evacuation.
- Tropical Cyclones (Hurricanes & Typhoons): Massive, slow-moving storm systems requiring days of advance preparation, mass coastal evacuations, and long-term sheltering.
- Tornadoes: Highly localized, rapid-onset wind events where the primary defense is immediate shelter-in-place warnings rather than evacuation.
- Severe Winter Storms & Blizzards: Extreme cold, ice, and heavy snowfall requiring power grid management, road closures, and widespread mobility stand-downs.
- Extreme Heatwaves: Prolonged periods of dangerously high temperatures requiring the deployment of public cooling centers and strain management on local power grids.
3.3 Hydrological & Climatological (Water & Environment-Driven)
These events relate to the distribution of water on earth and longer-term environmental shifts. They can range from rapid-onset to very slow, creeping disasters.
- Floods: Ranging from sudden flash floods to slow-rising river and coastal flooding, requiring swift-water rescue and long-term displacement management.
- Wildfires: Rapidly spreading, unpredictable fires requiring dynamic, constantly shifting evacuation perimeters and massive coordination of ground and air firefighting resources.
- Droughts: Slow-onset crises requiring agricultural intervention, long-term water rationing, and supply chain management.
3.4 Technological & Accidental Hazards
These are events caused by human error, mechanical failure, or the breakdown of critical infrastructure. There is no malicious intent, but the fallout can be catastrophic.
- Hazardous Materials (HazMat) Spills: Chemical plant leaks, toxic train derailments, or industrial gas releases requiring specialized containment and immediate, localized evacuation.
- Structural Failures: Bridge collapses, dam breaches, or building cave-ins requiring heavy urban search and rescue (USAR) and immediate perimeter control.
- Transportation Accidents: Mass casualty events involving commercial aviation crashes, multi-vehicle highway pile-ups, or maritime sinkings.
- Radiological & Nuclear Accidents: Incidents at nuclear power plants or during the transport of radioactive materials, requiring long-term quarantine zones and radiation monitoring.
- Critical Infrastructure Failures: Massive blackouts, municipal water contamination, or telecommunications grid collapses that paralyze a region's ability to function.
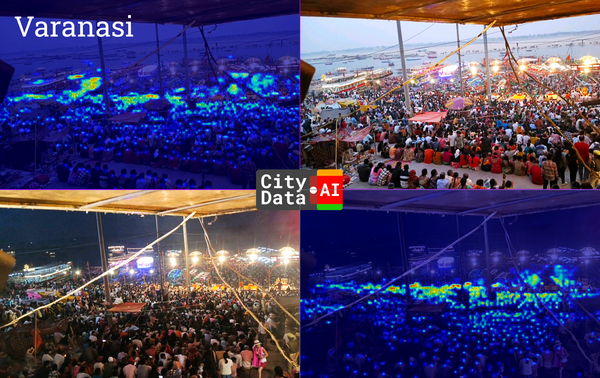
Event Analytics using Mobility Telemetry Data
Today, the landscape of urban analytics is undergoing a tectonic shift driven by big data. At CityData, we harness the massive, continuous streams of anonymized GPS data points generated by everyday mobile applications and connected vehicle telemetry. By ethically aggregating and analyzing this spatial data, we provide a high-fidelity, real-time map of human movement. We can infer highly accurate visitation counts, trace origin neighborhoods, and map aggregated demographic profiles using open census data — all while strictly protecting individual privacy.
The methodology we deploy is not one-size-fits-all. Human behavior changes drastically depending on the physical nature of an event. Below is a comprehensive look under the hood at how CityData’s algorithms extract actionable, life-saving, and revenue-driving intelligence across three distinct spatial categories: Fixed-Location Events, Route-Based Events, and Disasters and Hazards.
The Algorithmic Foundation: From Raw Pings to Rich Insights
Before examining specific event types, it is crucial to understand the foundational mechanics of mobility data analysis. CityData processes billions of spatial pings daily, but raw coordinates are useless without sophisticated data science.
- Inferring Visitation Counts via Geofencing and Expansion: We begin by establishing a spatial boundary—a digital geofence. We then count the unique, anonymized device IDs that emit signals within that polygon during a specified temporal window. Because not every human has a smartphone, and not every smartphone pings our network, we apply statistical expansion algorithms. By comparing our device panel to baseline census population data, we scale our sample size up to accurately represent the total actual crowd.
- Inferring Visitor Origins through "Home" Heuristics: To understand where a crowd came from, we do not track individuals in real-time. Instead, our algorithms look at a device's historical 30-day to 90-day footprint to identify where it most frequently "rests" during overnight hours (typically between midnight and 5:00 AM). This defines the device’s likely home neighborhood, usually narrowed down to a specific Census Block Group (CBG), without ever identifying a specific street address.
- Inferring Demographics via Spatial Aggregation: Once a visitor's origin CBG is identified, we cross-reference that geographic area with public United States Census Bureau and American Community Survey (ACS) data. If 5,000 attendees originate from a specific set of neighborhoods, we aggregate the known demographic averages of those neighborhoods. This allows us to accurately estimate the crowd's median household income, age distribution, education levels, and family structures, entirely shielding individual identities.
1. Fixed-Location Events: Mastering the Contained Crowd
Examples: Multi-day music festivals, stadium concerts, convention center expos, public square rallies.
For events held within a strictly defined perimeter, the analytical focus shifts toward accurate spatial containment, filtering out urban noise, and calculating precise dwell times.
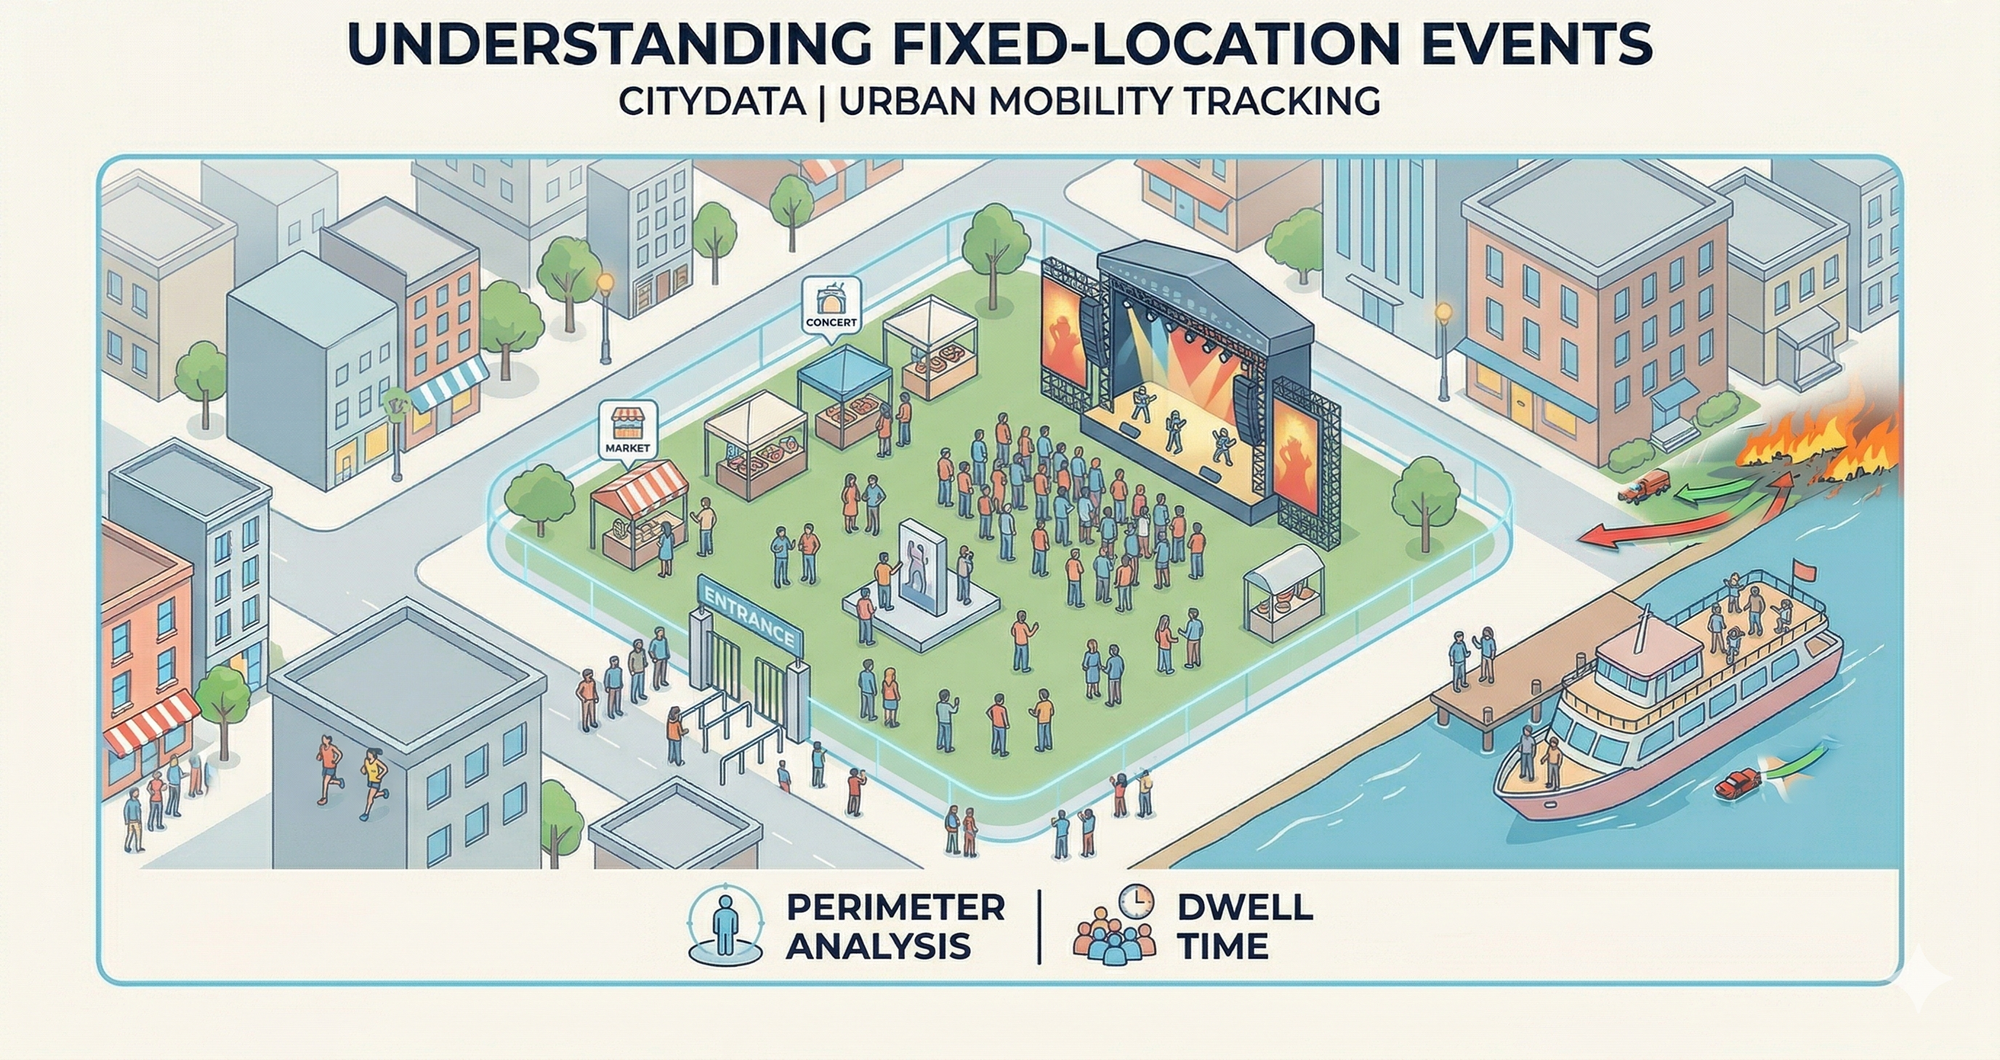
Visitation Counts: The Dwell Time Filter In a dense urban environment, drawing a polygon around a stadium will capture attendees, but it will also capture commuters driving on a nearby overpass, delivery drivers dropping off food, and pedestrians walking their dogs. CityData filters out this noise using strict dwell time parameters. For a device to be classified as an attendee at a three-hour concert, it must ping continuously within the venue's polygon for a minimum threshold (e.g., 45 minutes). We can also separate peak simultaneous attendance (the maximum crowd at one specific moment, vital for fire marshals) from cumulative attendance (the total unique visitors over a multi-day festival, vital for economic impact reports).
Visitor Origins: Heat-Mapping the Draw Because the crowd is stationary for a long period, origin analysis is incredibly robust. Event organizers can instantly generate heat maps showing exactly which zip codes, surrounding counties, or out-of-state regions drove the highest attendance. This allows tourism boards to measure the true economic injection of out-of-town visitors, factoring in hotel stays and local transit use based on the influx of non-resident devices.
Demographics & ROI: Proving the Value For fixed events, demographic inference is a game-changer for sponsorship and marketing. If a corporate sponsor pays for a brand activation at a food festival, CityData can analyze the demographic makeup of the specific crowd that dwelled near their activation tent. Organizers can prove to sponsors that their event successfully attracted high-income millennials, or families with young children, backing up marketing claims with hard geospatial evidence.
2. Route-Based Events: Tracking the Moving Target
Examples: City marathons, pride parades, political marches, championship motorcades.
Route-based events are exponentially more complex for data scientists. The geographic footprint is not a fixed box, but a winding, linear path. Furthermore, the environment is dynamic: both the participants and the spectators are in motion, and the event rolls through different neighborhoods over several hours.
Visitation Counts: Dynamic Buffers and Velocity Vectors Instead of a static polygon, CityData deploys a dynamic spatial buffer—a geofenced corridor that traces the exact route of the parade or race. To count accurately, we run complex vector analyses focusing on speed and direction. By analyzing the velocity of the pings, our algorithms segment the crowd into distinct groups:
- Participants: Devices moving continuously along the route at a specific pace (e.g., 6 miles per hour for marathon runners, or 3 miles per hour for parade floats).
- Spectators: Devices that travel to the route, stop, and cluster at a specific intersection or barricade for an extended period.
- Ambient Traffic: Connected vehicle telemetry moving perpendicular to the route, allowing us to identify drivers trapped in detours rather than attending the event.
Visitor Origins: Segment-by-Segment Analysis Unlike a stadium where everyone shares one experience, a parade route offers localized experiences. CityData can slice a 5-mile parade route into distinct segments. We often find that spectators at the beginning of a route are heavily localized (residents walking out of their nearby apartments), while crowds clustered near the finish line or downtown grandstands draw heavily from suburban tourists and out-of-town visitors.
Demographics: Municipal Resource Optimization Understanding how demographics shift along a route is invaluable for city services. If mobility data reveals that a specific stretch of a marathon route attracts massive crowds of families with young children, city planners can preemptively deploy more portable restrooms, medical tents, and lost-child stations to that exact segment.
3. Disasters and Hazards: The Lifesaving Power of Crisis Mobility
Examples: Approaching hurricanes, rapidly spreading wildfires, industrial HazMat spills, severe winter storms.
When a natural or human-caused disaster strikes, the mandate for mobility data pivots instantly. We are no longer measuring economic impact or marketing ROI; we are providing critical, real-time intelligence for life-safety, mass evacuation, and post-disaster recovery. The scale shifts from city blocks to massive regional footprints.
Visitation Counts: Measuring Displacement and Baseline Deviation During an emergency, the focus is on deviation from the norm. CityData establishes a baseline of normal population density for a region. When a hurricane evacuation order is issued, we monitor the sudden, precipitous drop in device density within the hazard zone (the coastal geofence). Simultaneously, we track the corresponding spike in density in safe-harbor cities inland. This displacement analysis allows emergency managers to accurately estimate the compliance rate of the evacuation order—knowing precisely how many people successfully left, and critically, how many remain trapped in the impact zone.
Origins & Evacuation Routes: Identifying the Bottlenecks By tracking the macro-level flow of connected vehicles and mobile devices fleeing a danger zone, CityData acts as a real-time circulatory monitor for regional infrastructure. If our telemetry shows thousands of devices moving at 0 miles per hour on a primary interstate out of a wildfire zone, we can instantly alert emergency command centers to traffic bottlenecks. This allows highway patrols to open counter-flow lanes or redirect evacuees to secondary rural routes before disaster overtakes them.
Demographics: The Social Vulnerability Index (SVI) This is arguably the most profound and vital application of CityData's technology. In every disaster, some populations cannot evacuate due to a lack of resources, disabilities, or lack of personal vehicles. By looking at the origin Census Block Groups of the devices that did not evacuate, we overlay our mobility data with the CDC's Social Vulnerability Index.
If our dashboards show a "zero-mobility" cluster—a neighborhood where device density remains high despite an evacuation order—and our demographic mapping indicates that this specific neighborhood has a high concentration of elderly residents living below the poverty line, it triggers immediate action. First responders, high-water rescue vehicles, and medical teams can be dispatched directly to that grid coordinate, removing the guesswork from urban search and rescue.
Conclusion: The Future of Spatial Intelligence
We are moving rapidly toward a future where cities are no longer static grids of concrete, but living, breathing ecosystems that can be understood in real-time. Whether an urban planner is designing a better traffic mitigation strategy for a stadium, an event producer is trying to build a more inclusive festival, or a first responder is looking for stranded citizens in a flood, the foundation of proactive decision-making is spatial truth. By transforming anonymous data into profound insights, CityData is helping build the resilient, responsive, and intelligent cities of tomorrow.