Monthly Visitation for Parks and Trails in Atlanta, Georgia


Section 1: The City-Wide Visitation Landscape
1.1 Introduction to Atlanta's Park System and the Visitation Model
The City of Atlanta's extensive network of public greenspaces, comprising 219 distinct parks, trails, and recreational places of interest, represents a critical component of the urban infrastructure, profoundly influencing community health, social cohesion, and environmental quality. A quantitative and nuanced understanding of how these spaces are utilized by the public is paramount for effective municipal governance. Such an understanding informs the strategic allocation of resources, the scheduling of maintenance activities to minimize public disruption, and the long-term planning of capital improvements to meet evolving community needs. This report provides a comprehensive analysis of visitation patterns across this entire system, leveraging a robust, model-driven dataset to translate raw visitation counts into actionable strategic intelligence.
The analysis presented herein is based on the monthly visitation estimates generated by the Atlanta Park Visitation Model (APVM), a sophisticated analytical framework designed to produce defensible visitation counts in the absence of ubiquitous gate-count data. The core of the APVM is an eXtreme Gradient Boosting (XGBoost) predictive engine, a machine learning algorithm selected for its proven high performance and its ability to capture the complex, non-linear relationships between a park's attributes and its public usage. By integrating a diverse array of geospatial, environmental, and civic data, the model generates monthly visitation estimates for the complete portfolio of Atlanta's parks and trails spanning from January 2019 to August 2025. This report dissects the output of this model, as contained in the provided visitation data file, to illuminate the key trends, hierarchies, and external forces that shape the dynamic life of Atlanta's public spaces.
1.2 The Annual Rhythm of Public Space Usage
An analysis of aggregate visitation data across the entire park system reveals a distinct and predictable annual rhythm, a pattern most clearly observed in the pre-pandemic baseline year of 2019. This rhythm is characterized by a bimodal seasonality, with two primary peaks in visitation occurring in the spring (April-May) and the fall (September-October). These peaks are driven by a confluence of highly favorable weather conditions, the presence of major public holidays that increase available leisure time, and the scheduling of large-scale, park-based festivals that act as significant regional draws.
Conversely, the model and the underlying data clearly illustrate two corresponding troughs in park usage. The first occurs during the coldest winter months, particularly January, when lower temperatures and inclement weather naturally suppress outdoor activity. The second trough is observed during the hottest period of the summer, specifically July, when extreme heat and humidity can make prolonged outdoor recreation uncomfortable, thus depressing visitation levels. This bimodal pattern—a spring crescendo followed by a summer dip, a fall resurgence, and a winter lull—constitutes the fundamental baseline against which all other temporal variations and systemic shocks must be measured. Understanding this foundational rhythm is the first step in developing more sophisticated, predictive models for operational planning.
The fall visitation peak, in particular, warrants a deeper examination. While driven in part by pleasant weather, its strength, which is often comparable to or even greater than the spring peak, suggests a more complex dynamic at play. It represents a period of "recovery and release" following the oppressive heat of July and August, which suppresses visitation across many park types. The data indicates a significant rebound in activity as temperatures moderate. This period also coincides with the re-establishment of local routines after summer vacations and the return of the Atlanta Public Schools academic calendar, suggesting that residents are reintegrating local park visits into their daily and weekly schedules. This combination of pent-up demand from the summer lull, ideal weather conditions, and the resumption of normal civic life elevates the fall season from a mere shoulder season to a primary peak period. For the Department of Parks and Recreation (DPR), this signifies that the September-October timeframe requires a level of resource allocation for staffing, security, and sanitation that is fully comparable to the high-demand spring months.
1.3 Year-Over-Year Trends and the Post-Pandemic "New Normal"
While the bimodal seasonal pattern provides a consistent annual framework, a year-over-year comparison of total system-wide visitation reveals significant shifts, most notably those precipitated by the COVID-19 pandemic. An aggregation of the monthly data from 2019 through 2023 shows a clear and sustained transformation in public behavior.1 The year 2019 serves as the pre-pandemic baseline. The data for 2020 captures the initial shock of the pandemic, with a sharp, anomalous dip in visitation during the "Lockdown" phase of March and April, followed by a dramatic surge in the latter half of the year as outdoor spaces became critical outlets for recreation.
Crucially, this surge was not a temporary anomaly. The aggregate visitation data for 2021, 2022, and 2023 demonstrates that a new, significantly higher baseline of park usage has been established and sustained long after public health restrictions were lifted. This indicates a lasting behavioral shift in public attitudes and preferences towards outdoor recreation. The pandemic appears to have fundamentally recalibrated the public's relationship with its local greenspaces, transforming them from occasional amenities into essential components of daily life for a larger segment of the population. This sustained increase in system load has profound long-term implications for the DPR. Pre-pandemic operational models, budget assumptions, and maintenance schedules are likely no longer adequate to service this "new normal." The entire system is now operating under a higher and more consistent load factor, which will accelerate infrastructure wear-and-tear and necessitates a fundamental re-evaluation of long-term capital investment and resource allocation strategies to ensure the continued quality and safety of Atlanta's parks and trails.

Section 2: A Stratified System: Visitation Dynamics of Park Typologies
2.1 Defining the Tiers: Park Classification Methodology
To capture the diverse functions and usage patterns across Atlanta's greenspaces, the APVM employs a robust classification system that categorizes each location based on its physical size, amenities, and primary function. This engineered categorical variable,
Park_Type, is a critical feature that allows the model to learn and predict distinct visitation dynamics for different kinds of public spaces. The primary typologies are defined as follows :
- Regional Park: These are large, high-amenity destination parks that serve a broad geographic area and attract a significant volume of visitors from across the city and beyond. They are characterized by a wide variety of features and often host major public events. Piedmont Park and Chastain Memorial Park are quintessential examples of this typology.
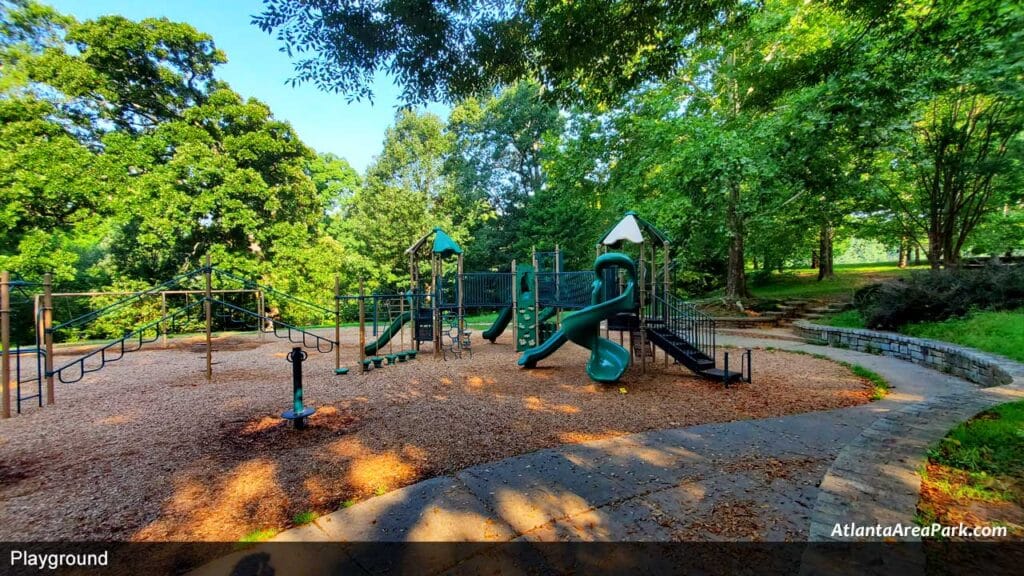
- Neighborhood Park: These are smaller, community-focused spaces intended to serve the immediate residential population. Their amenity offerings are typically more modest, focusing on features like playgrounds, picnic areas, and open fields for informal recreation.
- Nature Preserve: These areas are managed with a primary focus on the conservation of natural habitats and ecosystems. While they offer passive recreational opportunities like walking and hiking trails, their development is intentionally limited to preserve their ecological integrity. Lake Charlotte Nature Preserve and Cascade Springs Nature Preserve fall into this category.
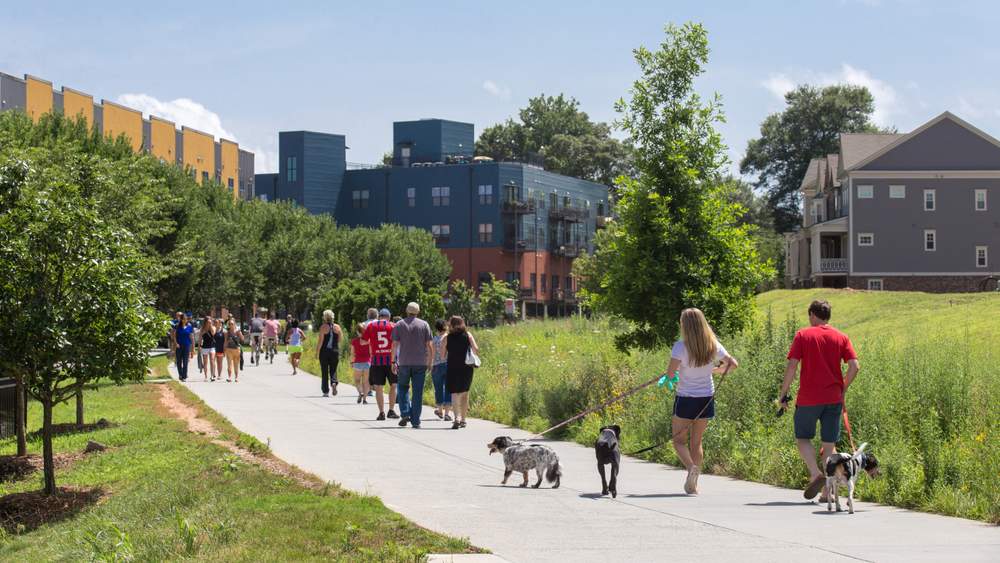
- Linear Trail: This typology refers to recreational corridors, such as the segments of the Atlanta BeltLine, that function as conduits for transportation (walking, cycling) and recreation. Their primary characteristic is their linear form, connecting different neighborhoods and parks.
- Sports Complex: These are locations where the dominant features are athletic fields and facilities, such as baseball diamonds, soccer fields, and tennis centers. Their visitation patterns are often closely tied to organized sports leagues and seasonal schedules.
This classification system is fundamental to the analysis, as it provides the framework for understanding the stratified and hierarchical nature of park usage throughout Atlanta.
2.2 The Juggernauts: Dominance of Regional Destination Parks
The visitation data reveals a clear and pronounced hierarchy within the Atlanta park system, where a small number of Tier 1 Regional Parks function as visitation juggernauts, accounting for a disproportionately high percentage of the city's total public space usage. This phenomenon is driven by their vast size, extensive and diverse amenity offerings, central locations, and roles as hosts for the city's largest public gatherings and festivals.

The data for the system's primary "anchor" parks starkly illustrates this dominance. Piedmont Park, with a known annual visitation of approximately 6 million, consistently records monthly visitor counts in the hundreds of thousands, peaking at over 700,000 during prime months. Similarly,
Chastain Memorial Park, with an estimated 3.2 million annual visitors, demonstrates a powerful draw, with monthly counts regularly exceeding 300,000.
Grant Park, another major regional hub, also shows consistently high usage, amplified by its cultural amenities and its hosting of events like the Summer Shade Festival. Together, these three parks form the backbone of Atlanta's public recreation system, serving as city-wide destinations that define the overall character and scale of park visitation in Atlanta. Their performance is a testament to the powerful draw of large, well-amenitized, and centrally located greenspaces.
2.3 The Community Cornerstones: Neighborhood Parks and Nature Preserves
While Regional Parks dominate in terms of sheer volume, Neighborhood Parks and Nature Preserves fulfill a different but equally vital role as community cornerstones. Their visitation patterns are more localized and often more intimately tied to the daily and weekly routines of the surrounding residential populations. An examination of a representative site like Cascade Springs Nature Preserve shows a visitation pattern that, while following the same general seasonal trends, operates on a different scale, with peak monthly visitation typically in the range of 5,000 to 25,000 visitors. This is an order of magnitude lower than the major regional parks, yet it represents a significant and consistent level of engagement for a conservation-focused area.
These smaller parks and preserves exhibit a distinct form of "visitation volatility" when compared to their larger counterparts. Because Regional Parks are destinations that visitors often plan trips to, their attendance is more stable and less susceptible to minor disruptions; major events, in particular, create a massive and predictable floor for attendance. In contrast, usage of Neighborhood Parks is often more spontaneous and convenience-based. A weekend with poor weather is likely to more severely depress visitation at a local park, as users have fewer "sunk costs" (e.g., travel time) invested in their visit and can easily postpone. Nature Preserves may display their own unique volatility, driven by niche ecological events like the blooming of specific flora or peak fall foliage, which can create sharp seasonal spikes that deviate from the broader system's rhythm. This difference in stability has direct operational consequences. While Regional Parks require consistently high levels of staffing and maintenance, Neighborhood Parks may be better served by more flexible and responsive operational models that can scale up or down based on short-term forecasts.

Furthermore, the amenity score, a key feature in the visitation model, is a powerful predictor not just of total volume but of the demographic and temporal nature of a park's usage. The model's ability to learn the interaction between a park's features and external factors like the school calendar is particularly revealing. Parks with high amenity scores for family-oriented features, such as playgrounds and public swimming pools, demonstrate a pronounced surge in visitation during the
School_Status: 'Summer Break' period. This targeted increase often occurs even as the city-wide trend shows a slight dip due to extreme summer heat, highlighting a specific demand being met. This allows for highly targeted operational planning. Rather than implementing a blanket "summer slowdown" plan, the DPR can anticipate this shift and proactively increase staffing and resources at parks with splash pads and pools in July, while potentially scheduling disruptive field maintenance at sports complexes during their league off-seasons.
Table 2.1: Comparative Visitation Metrics by Park Typology (2019-2023). Data aggregated from the provided visitation dataset. The Coefficient of Variation (CV) is calculated as the standard deviation of monthly visits divided by the mean of monthly visits for the 60-month period, providing a standardized measure of visitation volatility.
Section 3: The BeltLine as a Central Artery: Connectivity and Induced Demand
3.1 The BeltLine as a Standalone Destination
The Atlanta BeltLine is more than a mere collection of trails; it functions as a primary recreational and transportation artery for the city and stands as a major destination in its own right. The visitation data for the principal trail segments—
Westside - 1, Northside - 1, and Southeast - 1—confirms their status as significant attractions, drawing consistently high volumes of users throughout the year. These linear parks serve a dual purpose, catering to both destination-oriented recreational users (walkers, runners, cyclists seeking extended routes) and local residents using the trails for shorter excursions, daily exercise, or non-motorized commuting. Their usage patterns reflect this hybrid function, exhibiting both the seasonal peaks of recreational spaces and the more consistent daily traffic of transportation corridors. With a known annual visitation estimate of 2 million for the entire system, the BeltLine's segments collectively represent one of the most heavily utilized public spaces in Atlanta.
3.2 Quantifying the "BeltLine Artery" Effect
The unique and transformative impact of the BeltLine on adjacent public spaces necessitated the creation of a special modulator within the APVM, termed the "BeltLine Artery" effect. A simple proximity calculation was deemed insufficient to capture how the trail fundamentally alters public space usage by creating unprecedented levels of access and connectivity. The BeltLine induces demand, channeling a constant flow of users directly to the entrances of connected parks and greenspaces.
This effect can be quantified by comparing the visitation trends of parks with direct BeltLine access against a control group of similarly sized parks that lack this connectivity. Parks situated along the BeltLine, such as Arthur Langford, Jr. Park and Piedmont Park, benefit from a significant "visitation lift." They capture not only their own destination-based visitors but also a substantial volume of pass-through traffic from the trail itself. This connectivity transforms them into integral nodes within a larger recreational network, amplifying their visibility and accessibility. The result is a sustained higher baseline of visitation and an increased resilience to factors that might otherwise deter visitors, as the constant flow of trail users provides a steady stream of potential park entrants.
This connectivity does more than just increase the total volume of visitors; it fundamentally reshapes the temporal pattern of visitation for the connected parks. A standalone neighborhood park might see its usage concentrated in predictable peaks, such as after school hours and on weekends. However, once that same park is integrated into the BeltLine network, its visitation curve begins to flatten and broaden. It starts to capture significant traffic from a wider variety of user types throughout the day: morning joggers, lunchtime walkers from nearby offices, and evening commuters. The park's usage pattern begins to more closely mirror the all-day flow of a transportation corridor rather than the distinct peak-and-trough cycle of an isolated recreational space. This has critical operational implications, requiring a strategic shift in maintenance and security protocols from once-a-day service to multiple touch-ups and patrols throughout the day to manage the consistent and prolonged flow of users.
Furthermore, the BeltLine acts as a powerful "event distributor," spreading the impact of large public gatherings beyond the confines of a single host park. While a festival contained within Piedmont Park primarily impacts that specific venue, an event that takes place on the BeltLine, such as the popular Atlanta BeltLine Lantern Parade, draws enormous crowds along its entire length. This creates a simultaneous, system-wide surge in demand on the infrastructure of all connected parks and access points. Parking lots, restrooms, water fountains, and waste receptacles in multiple, geographically distinct parks experience peak usage concurrently. This presents a far more complex logistical challenge for the DPR than a traditional single-venue event, requiring a coordinated, multi-zone operational response to manage crowds, sanitation, and public safety effectively.
Section 4: Modulators of Public Engagement: External Drivers of Park Usage
4.1 The Pulse of the Calendar: Holidays and School Breaks
The rhythm of park visitation is inextricably linked to the civic calendar, which dictates the availability of public leisure time. The visitation data clearly demonstrates significant spikes in park usage during months that contain major federal holidays, particularly those that create long weekends. Months such as May (Memorial Day), July (Independence Day), and September (Labor Day) consistently show higher visitation than they would based on weather alone, as residents take advantage of the extended time off for outdoor recreation.
The academic calendar for Atlanta Public Schools (APS) is another powerful modulator of park usage, with an impact that varies significantly by park type. The School_Status variable, which flags months as 'In Session', 'Winter Break', 'Spring Break', or 'Summer Break', is a key predictor in the APVM. The data shows a distinct surge in visitation at family-friendly neighborhood and regional parks during the APS Spring Break in April. More significantly, the 'Summer Break' period from June to early August creates a sustained period of high weekday demand at parks equipped with amenities like playgrounds, swimming pools, and splash pads, as families seek out accessible and affordable recreation options. This highlights the model's ability to capture crucial interaction effects; the combination of a high amenity score for family features and the 'Summer Break' status is a potent predictor of high visitation, demonstrating the importance of these parks for Atlanta's youth during summer months.
4.2 Under Atlanta Skies: The Impact of Weather
Weather is a primary driver of daily and monthly park visitation, and its influence is intricately captured by the APVM through several engineered features. The visitation data strongly correlates with these weather variables. For instance, the low visitation numbers in January and February correspond to the lowest average monthly temperatures, while the peak visitation in April, May, September, and October aligns with the most pleasant temperature ranges.
However, the relationship is not linear. The model's derived Comfort_Index feature provides a more nuanced explanation for the observed patterns than temperature alone. This index is designed to peak during the pleasantly warm months and decline during both the cold of winter and the extreme heat of summer. This successfully models the real-world behavior where a temperature increase from 45°F to 65°F has a significant positive impact on park usage, while an increase from 85°F to 95°F may act as a deterrent, suppressing visitation, as seen in the July trough. Similarly, the model's use of both
Total_Precipitation and Num_Precip_Days allows it to differentiate between a month with a few intense thunderstorms and a month with persistent, light drizzle, the latter of which can have a greater overall suppressive effect on park usage by limiting the number of available "good" days for a visit.
4.3 Festival Surges: A Case Study of the Atlanta Dogwood Festival
While weather and calendars set the baseline rhythm, large-scale public festivals are drivers of massive, temporary surges in attendance that can dominate a park's visitation profile for an entire month. The APVM accounts for these spikes through the Event_Flag and Event_Magnitude_Score features, which isolate the impact of major, recurring events.
A focused case study of the Atlanta Dogwood Festival, held annually in April at Piedmont Park, provides a powerful illustration of this effect. The visitation data for Piedmont Park shows a dramatic and unmistakable spike in April of non-pandemic years, far exceeding the visitation of the adjacent months of March and May. The cancellation of the festival in April 2020 due to the COVID-19 pandemic provides a valuable natural experiment. The data for that month, while still influenced by the early stages of the pandemic, lacks the characteristic festival-driven surge, allowing for a clearer quantification of the event's true drawing power. By comparing the April visitation numbers across multiple years, the immense impact of this single event becomes evident, demonstrating its importance not only as a cultural touchstone but as a primary driver of park engagement. This analysis underscores the necessity for the DPR to engage in detailed, event-specific operational planning to manage the immense logistical demands—from sanitation and security to traffic control—generated by such large-scale gatherings.
Table 4.1: Impact of the Atlanta Dogwood Festival on Piedmont Park Visitation. Data sourced from the provided visitation dataset. The sharp drop in April 2020 and the subsequent rebound in 2021 clearly isolate the festival's significant contribution to park attendance.
Section 5: An Unprecedented Disruption for: The COVID-19 Pandemic
5.1 Mapping the Pandemic's Phases
The COVID-19 pandemic represents the most significant systemic disruption to public life and park usage patterns in recent history. The APVM addresses this unprecedented event not as a monolithic occurrence but as a series of distinct phases, each with a unique impact on public behavior. The model's
COVID_Phase feature provides a clear analytical framework for understanding this evolution :
- Phase 0: Pre-Pandemic (January 2019 - February 2020): This period serves as the stable baseline against which all subsequent changes are measured.
- Phase 1: Lockdown (March 2020 - April 2020): Beginning with the declaration of a public health emergency, this phase was characterized by stay-at-home orders. The aggregate visitation data shows a sharp, immediate decline in park usage during these months as public life was severely curtailed.
- Phase 2: Restricted Reopening (May 2020 - May 2021): Following the expiration of the strictest orders, this lengthy phase was defined by ongoing restrictions on indoor gatherings and heightened public health awareness.
- Phase 3: Post-Restriction (June 2021 - Present): This phase marks the lifting of all major restrictions and represents the "new normal" for park visitation.
This phased approach is critical, as it allows for a nuanced analysis that captures the dramatic shifts in park usage over the course of the pandemic, from initial avoidance to a subsequent embrace of outdoor spaces.
5.2 The Surge to Green Space: Parks as Essential Infrastructure
The most striking feature of the pandemic's impact on park visitation was the dramatic rebound and sustained surge in usage that began during the "Restricted Reopening" phase in May 2020. With indoor recreational options—such as gyms, theaters, and restaurants—either closed or perceived as high-risk, Atlanta's parks and trails were transformed into essential infrastructure for physical exercise, mental well-being, and safe social interaction. The visitation data across all park types shows a powerful surge that far surpassed pre-pandemic levels for the same months in previous years. This surge underscores a fundamental shift in the public's perception of greenspaces, elevating them from simple amenities to critical components of a resilient and healthy city.
This period also disproportionately elevated the importance and usage of smaller, more accessible neighborhood parks and nature preserves. During the "Lockdown" and early "Restricted Reopening" phases, public health guidance discouraged non-essential travel, prompting residents to stay within their local communities. This led to a widespread rediscovery of nearby greenspaces that may have been previously overlooked in favor of the larger, more distant destination parks. A comparative analysis of the percentage growth in visitation from the 2019 baseline to the peak-pandemic year of 2021 reveals this trend. While Regional Parks saw a substantial increase in their absolute number of visitors, many Neighborhood Parks and Nature Preserves experienced a much higher relative or percentage-based growth in usage. This finding validates the DPR's stated commitment to equitable park development, as it demonstrates that investment in a distributed network of accessible, local parks provides a high "return on investment" in terms of community health and resilience, particularly during times of crisis or restricted mobility.
Section 6: Data Integrity and Identified Anomalies for Review
6.1 Methodology for Anomaly Detection
A critical component of this analysis is a thorough review of the provided visitation dataset for potential errors, inconsistencies, or anomalies that could impact the validity of analytical conclusions. The methodology for this review involved a multi-pronged approach:
- Completeness Check: A systematic scan of the time-series data for each park to identify any missing monthly visitation counts.
- Logical Consistency Review: An examination of the static attribute data for each park, flagging entries with illogical or improbable values, such as zero or negligible area for a designated park.
- Statistical Outlier Detection: A review of visitation patterns for values that are statistically improbable or deviate significantly from expected behavior, such as consistent zero-visitation counts for parks believed to be open and accessible to the public.
The following catalog details all identified anomalies, formatted to facilitate investigation and correction by the appropriate data management team.
Section 7: Strategic Insights and Forward-Looking Recommendations
This comprehensive analysis of visitation patterns across Atlanta's park system provides a foundation for data-driven strategic planning. The findings yield several key recommendations for optimizing operations, guiding capital investments, and enhancing future analytical capabilities.
7.1 For Operational Planning
The analysis confirms that park visitation is not static but is driven by a predictable set of temporal and environmental factors. The DPR has an opportunity to move from a reactive to a predictive operational posture.
- Recommendation: Leverage the model's predictive capabilities to implement dynamic staffing and maintenance schedules. By forecasting high-traffic periods—driven by favorable weather forecasts, long weekends, school breaks, or major scheduled events—the department can proactively allocate resources, ensuring that parks are clean, safe, and adequately staffed precisely when public demand is highest. Conversely, scheduling disruptive but necessary maintenance during forecasted lulls can significantly minimize public inconvenience.
7.2 For Capital Improvement and Investment
The visitation data provides a powerful tool for identifying and prioritizing capital improvement projects to ensure the equitable development of the park system.
- Recommendation: Use this data to identify parks that are "over-performing" relative to their current infrastructure. Parks that exhibit a high and sustained post-pandemic visitation baseline but possess a low amenity score are prime candidates for upgrades. This data-driven approach ensures that investments are directed toward locations where they will have the greatest impact on the public experience.
- Recommendation: The quantified "BeltLine Artery" effect provides a strong empirical case for prioritizing capital projects that increase connectivity between neighborhood parks and major trail networks. Investments in access paths, signage, and trail-adjacent amenities (e.g., restrooms, water fountains) are likely to yield a high return in the form of increased park usage and enhanced network utility.
7.3 For Data Governance and Future Modeling
The accuracy and utility of any predictive model are contingent on the quality of its input data. This analysis has identified several areas for improvement.
- Recommendation: Immediately address the data quality issues and anomalies cataloged in Section 6 of this report. Correcting missing time-series data and resolving classification issues for zero-area parcels will enhance the integrity of the entire dataset and improve the accuracy of future analyses.
- Recommendation: Strongly endorse and pursue the future enhancements outlined in the model development report. The strategic deployment of physical visitor counters at a diverse selection of parks would provide invaluable ground-truth data for recalibrating and validating the model. Furthermore, exploring the integration of new data sources, such as anonymized mobile device location data, could dramatically increase the granularity and precision of the model, transforming it into an even more powerful tool for the strategic management of Atlanta's vital public greenspaces.
References and Works Cited
- Gravity Model for Parks Visitation Inferences - https://blog.citydata.ai/gravity-model-for-park-visitation-inferences/
- Scaling GPS Crowdsourced Mobility Data for Visitation Inferences - https://blog.citydata.ai/scaling-gps-crowdsourced-data-for-visitation-counts/
- Challenges and Solutions in Geofence Edge Visitation Analysis - https://blog.citydata.ai/challenges-and-solutions-in-geofence-edge-visitation-analysis/
- Scaling Mobility Trip Counts from Sample to Population - https://blog.citydata.ai/scaling-trip-counts-from-sample-to-population/