Singapore Mobility Trip Patterns Published as Open Dataset

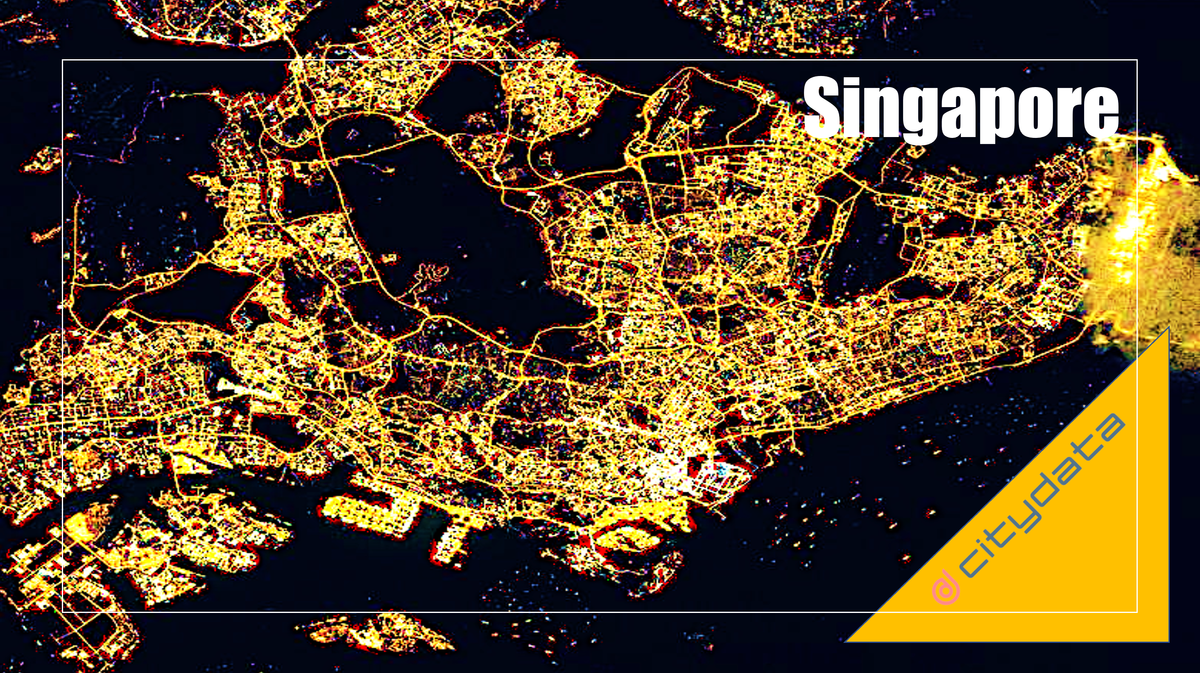
This blog posts delves into the mobility data and trip hop movement patterns for Singapore, the financial capital of Asia. The mobility data referenced in this blog post are published as an open dataset and is now available for download.
Sign up for our webinars to learn from our data scientists and geospatial experts. They will show you how geospatial intelligence can be used in the most cost-effective way to measure and analyze movement patterns.
CITYDATA holds fresh, accurate, anonymized, crowdsourced mobility data for approximately 2.75 million devices in Singapore measured each month. With the changes in people-behaviors due to COVID-19, municipalities, transportation agencies, real-world businesses, and academic researchers are in need of a reliable baseline for measuring the variations in mobility patterns over time.
September tends to be the preferred month for baselining mobility patterns. To that end, we have computed the mobility trip hops for Singapore for the month of September. The original dataset was filtered down to 262,830 devices which exhibited high levels of mobility in the form of 1,941,965 trip hops.
For the purposes of animation and visualization, we further reduced the dataset to the top-5000 devices ranked by trip counts. The video at the below link shows the mobility patterns for the top-5000 devices and 368,136 trip hops on a high resolution geohash gird, visualized with a time series animation powered by the open source kepler.gl tool.
Open Data
We have published the Singapore mobility trip patterns as an open dataset for the benefit of everyone. It is our sincere hope that researchers, academics, urban planners, and government agencies will make the most of our open data.
To access the open dataset, you will need to sign up for a new account on our platform CITYDASH.ai. After you sign into your new account, you will find the link to access all of the free open datasets, including the Singapore mobility trip hops.
Over the next few weeks, we intend to discuss and analyze the Singapore mobility trip hops open dataset with the members of the UniverCity Council, an advisory board for public + private + academic data collaboration for civic innovation on a global scale. If you haven't yet signed up to become a member of the UniverCity Council, we highly recommend that you do so here.
More Data
Reach out to us if you'd like to compute additional months of mobility data for Singapore or for any of the top 1000 cities and metro areas in Malaysia, Indonesia, Thailand, India, Bangladesh, Myanmar, Vietnam, Cambodia, Australia, New Zealand, Taiwan, Japan, United Arab Emirates, United States, Canada, Mexico, Brazil, Argentina, Colombia, Chile, Peru, Italy, Spain. Our mobility patterns are available for all cities, districts, states, and countries.
About CITYDATA.ai
CITYDATA.ai provides pattern-of-life mobility data + Ai for smart cities. CITYDATA knows the answers to the questions “how many people are in your city today” and “what are their movement patterns?”.
CITYDATA offers five main data-as-a-service products:
- CITYDASH: on-demand daily mobility insights for global cities across 60 countries
- CITYCHAT: mobile chatbot platform for citizen engagement and data sharing
- CITYFLOW: fleet tracking solution for cities, transportation and enterprise businesses
- CITYWORKS: mobile workforce management solution for cities and businesses
- CITYSDK: an embeddable component for cities to use in their mobile apps
Founded in 2020 in San Francisco, California, CITYDATA provides fresh, accurate, daily insights that are essential for smart city programs, economic development, urban planning, mobility and transportation, tourism, disaster impact analysis, sustainability and resilience.
You can reach the company via email at business@citydata.ai if you’d like to discuss your data needs and use cases. You can also follow the company on Linkedin, Twitter, Facebook, YouTube, and the UniverCity.ai blog to stay updated on the newest innovations in mobility data + Ai.


