Crowd Size Estimation for Large Gatherings, Rallies, Parades
CityData captures, measures, and estimates crowd sizes for large events like fireworks celebrations, farmers markets, music concerts, sporting events, religious events, political rallies and protests.
CityData offers two solutions for estimating crowd size.
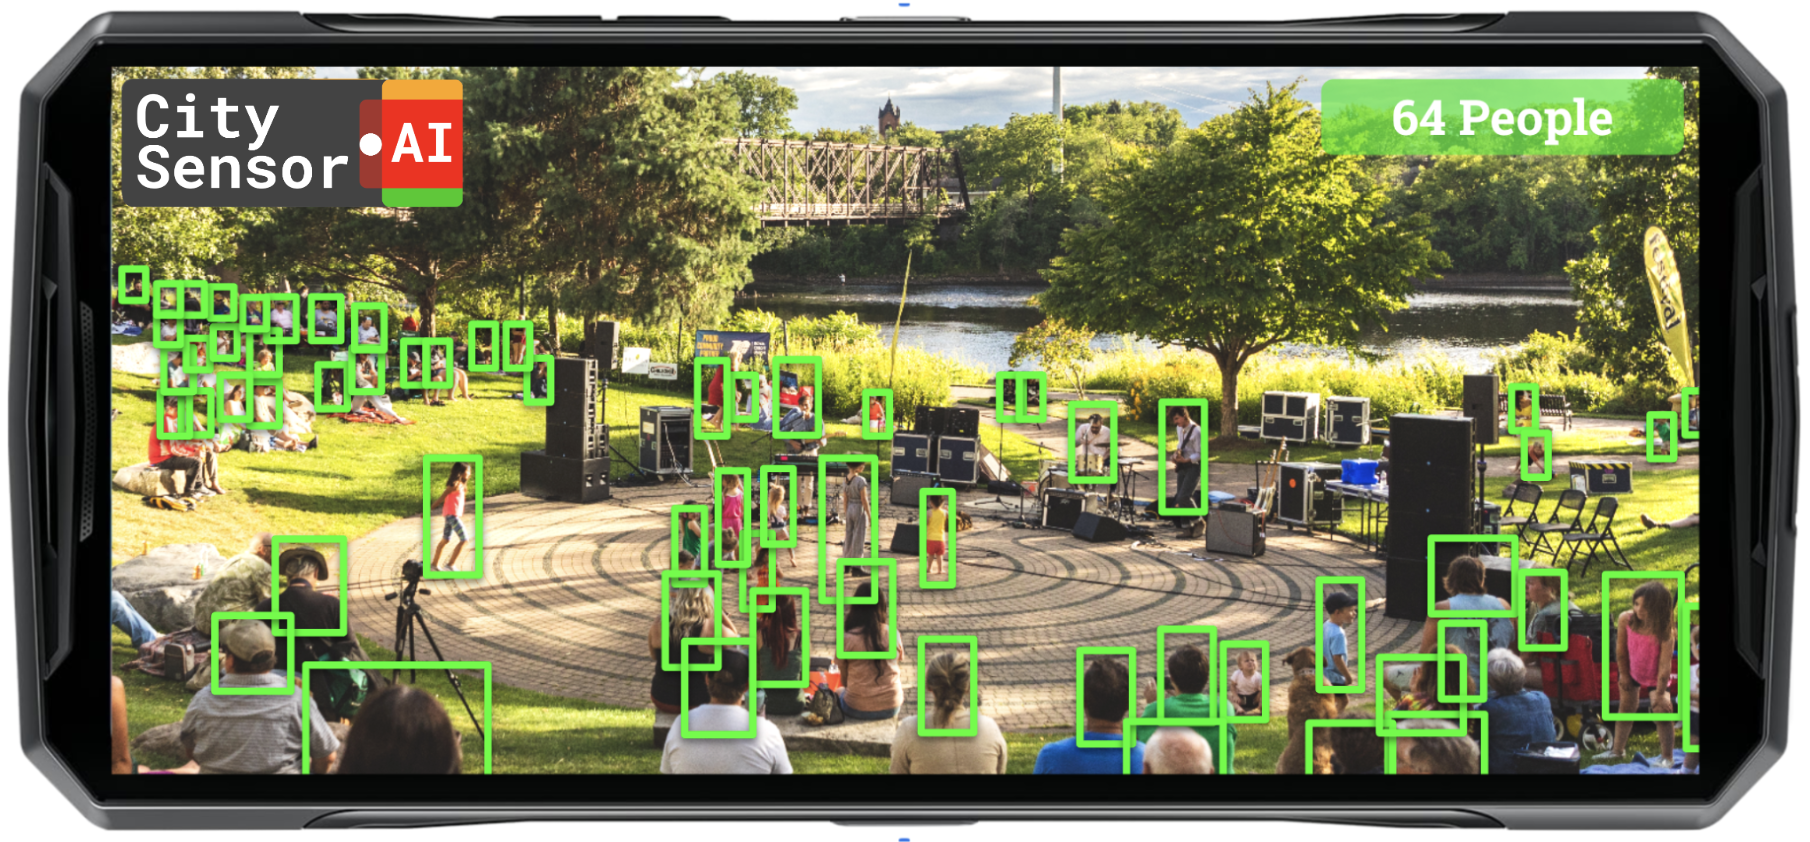
Solution 1: CitySensor
CitySensor is a ruggedized hardware sensor connected to an online dashboard for accurate real-time counting of people and vehicles.
Solution 2: CitySurvey
CitySurvey is a free mobile application with computer vision AI that can be used on any mobile device for running surveys to count people and vehicles. This write-up focuses on the CitySurvey solution.
Data Inputs
The inputs for CityData’s crowd counting solution consist of one or more of the datasets listed below:
- CCTV-captured low resolution images
- CitySensor-captured high resolution images
- Drone-captured wide area medium resolution images
- Crowdsourced mobility data from apps, hot spots, IoT networks
- Weather data
- Temperature
- Precipitation
- Humidity
- Wind speed
- Air quality
- Visibility
- Local context
- Land terrain
- Road network
- Public transit network
- Parks and open spaces
- Local businesses
- Regional restrictions
- Law enforcement policies
It is important to note that the input datasets are privacy compliant at the time of sourcing, or transformed and anonymized immediately after sourcing to ensure compliance before analyzing and processing using AI.
Methodology
Crowd counting fundamentally relies on computer vision object detection. CityData’s AI models have been trained on massive datasets containing images of crowds with labeled objects. This training allows CityData to recognize the visual patterns, shapes, and features that constitute a "person" based on characteristics and features such as heads, shoulders, torsos, arms, legs, hands, and feet.
For very dense crowds, simple object detection can be inaccurate because people overlap significantly. Instead of just trying to draw a box around every single person, density estimation techniques are combined with classic computer vision object detection for estimating counts in dense situations.
Moving crowds make for a more challenging estimation because the model must also take into account the flow rate of the crowd in terms of meters per minute. Longer rallies can last many hours with people entering and exiting at different times. The overall ebb and flow of the crowd must be taken into account as well. Such flow rates can be computed using privacy compliant mobility data from apps on cell phones. The flow rate can also be confirmed using video streams from drones and CCTV cameras.

Crowd Density
Crowd density is often measured on the following scale:
Loose Crowd
Density: 1-to-2 people per square meter
Characteristics: People can move freely without touching. This density is often seen at farmers markets or food and wine festivals.
Dense Crowd
Density: 3-to-4 people per square meter
Characteristics: Movement becomes restricted. This density is often seen at music concerts or large public gatherings.
Crushing Crowd
Density: 5-to-6 people per square meter
Characteristics: Personal space is completely eliminated. Individuals start to move involuntarily. This density is sometimes seen at political rallies or religious events. The overall crowd exhibits fluid-like characteristics. This density level is extremely dangerous and can lead to asphyxiation, stampedes, and fatalities.
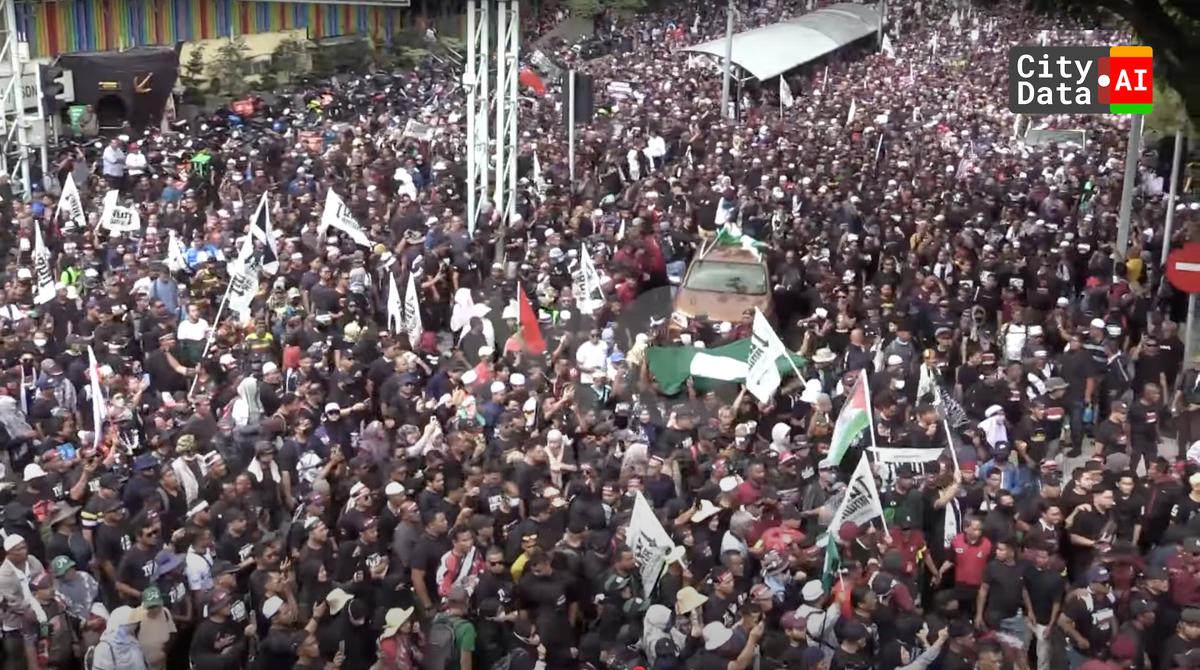
Political Rally in Malaysia
The Turun Anwar rally in Malaysia was held on Saturday, July 26, 2025. The main gathering point was Dataran Merdeka (Independence Square) in Kuala Lumpur, Malaysia. Participants marched from Central Market to Merdeka Square. Media coverage videos and drone footage of the event are widely available online in news reports, on YouTube, and through social media channels.
According to news reports, protesters began to gather at various locations as early as 10:00 AM. The main march to Dataran Merdeka began around midday, with speeches and activities continuing throughout the afternoon. The Wikipedia entry for the event lists a full duration from 9:00 AM to 6:00 PM for a total of 9 hours or 540 minutes. While core activities lasted for three hours (180 minutes), the period of peak crowd density and activity was approximately 60 minutes before the crowd began to disperse.

The estimated participation varied widely, depending on the source:
- Astro Awani estimated about 10,000 to 15,000 people participated.
- Free Malaysia Today declared that 18,000 people attended.
- Malaysiakini stated 25,000 people showed up for the event.
- Cilisos.my calculated that 25,138 people rallied that day.
- Perikatan Nasional (PN), who organized the event, estimated some 300,000 people to show up.
- Kuala Lumpur Police released their estimate of approximately 18,000 to 25,000 participants.
Video footage also reveals that the crowd was mostly standing or stationary during the 3 hours of the protest. However, crowd marching movement was visible for short periods of time. The resulting flow rate adds a dynamic element and should be factored into the crowd size analysis.
CityData’s Analysis
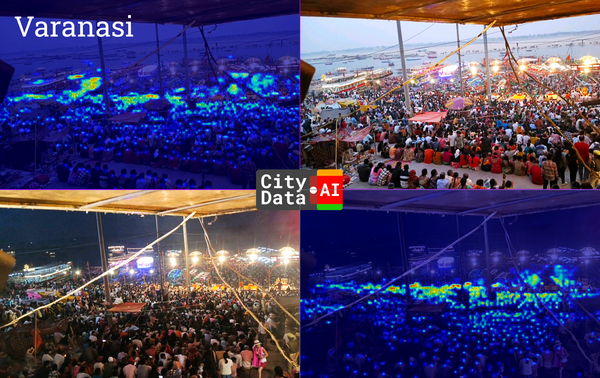
CityData leveraged the pictures and videos available online to estimate the crowd size for this political rally. We inferred an initial count using classic computer vision techniques. We then analyzing the texture and density of different regions in the image by creating an internal "heat map" where hotter areas correspond to a higher concentration of people,. and calculating the final count by integrating the values across this density map. CityData also took into consideration the flow rate of the crowd
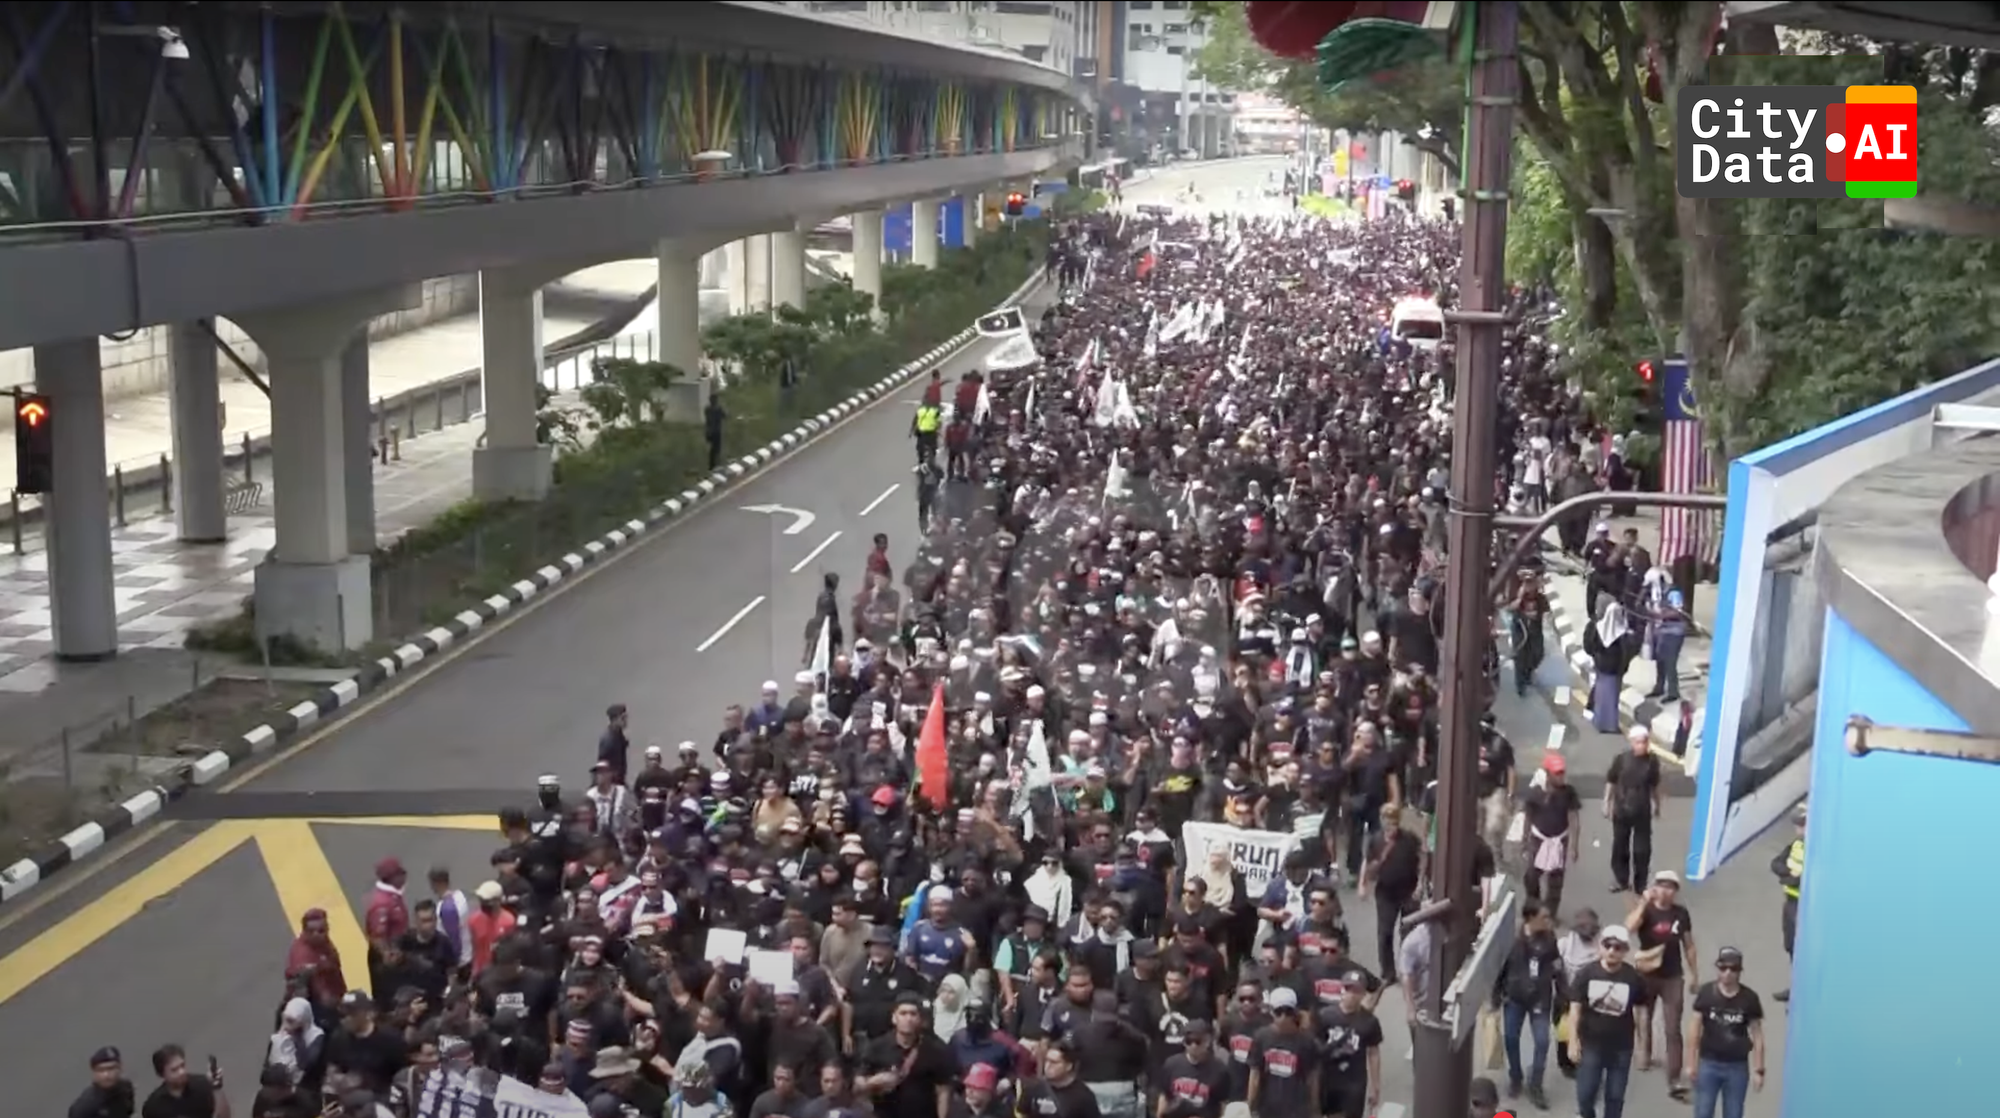
The AI analyzed different sections of the image to estimate density. The final numbers were calculated by combining the estimates from the densely packed areas in the middle and background with the more sparsely populated areas in the foreground. The main difficulty is the extreme occlusion and density in the middle and background of each image, where individuals merge into a large mass.

The crowd density for this event was variable. The peripheries of the crowd and some sections of the marching column had an approximate density in the range of 2 to 3 people per square meter. The core of the crowd, where individuals were packed shoulder-to-shoulder with no personal space, had an approximate density between 4 to 6 people per square meter. In the absolute epicenter of the protest, the crowd density clearly reached and likely exceeded the crushing density threshold.
CityData’s computer vision AI based density estimates were:
- Average crowd density of 4.2 people per square meter.
- Concentrated maximum crowd density of 5.6 people per square meter.

The crowds were seen along Dataran Merdeka (Jalan Raja) Road and the surrounding areas. By studying the high-resolution satellite imagery from Google, CityData estimated the total area occupied by the crowd to be approximately 12,552 square meters. CityData also estimated the width of the road to be approximately 29 meters.
CityData applied the below formula to estimate the crowd size.
Crowd size of the event =
Crowd density x [ Land area + ( Flow rate during peak event x Average width of area x Duration of event ) ]
We have established that,
- Crowd density = 4.2 people per square meter on average
- Land area = 12,552 square meters
- Average width of area = 29 meters
- Flow rate during peak event = 0 meters per minute
- Duration of peak event = 60 minutes
Therefore,
Crowd size of the event = 4.2 x [ 12,552 + ( 0 x 29 x 60 ) ] = 52,718 people
CityData estimates a crowd size of 52,718 people based on the assumption that the crowd was stationary for the most part during the rally.
If however, we were to assume that the crowd was moving very slowly during the 60 peak minutes of the protest, we would need to input a flow rate of 0.1 kilometer per hour which equates to approximately 1.67 meters per minute into the formula. The crowd size estimation would increase as shown below.
Crowd size of the event = 4.2 x [ 12,552 + ( 1.67 x 29 x 60 ) ] = 64,923 people
Conclusion
CityData's estimate provides a more robust, data-driven figure than simple media or official observational counts. This is because it is based on a transparent methodology that applies proven computer vision techniques to analyze both the occupied area and the crowd's true density, while also accounting for the dynamic element of crowd flow.
CityData will continue to monitor major events and rallies around the world and publish our findings and estimations for crowd size.
Reach out to business@citydata.ai if you'd like to leverage our big data + AI solutions for analyzing events, festivals, celebrations, concerts, markets, rallies, gatherings, or protests.